


echarts 柱状图和饼状图动态获取后台数据
运用echarts来实现图表
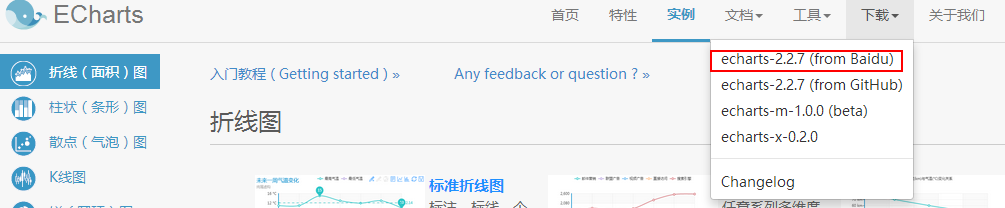
1.首先下载echarts包 http://echarts.baidu.com/echarts2/doc/example.html,在这里我下载的是
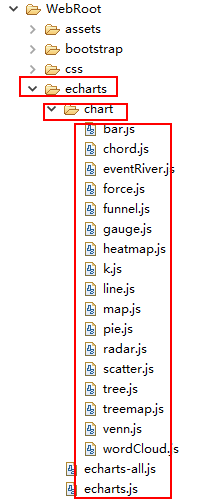
2.将echarts包放到项目中,这是我在项目中的路径
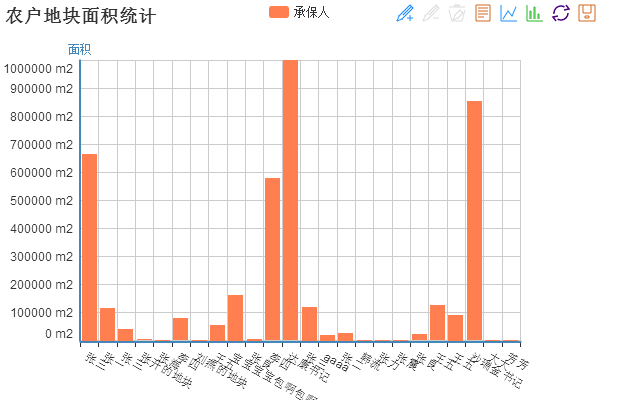
3.柱状图的动态获取
首先 1)需要引入:
1  <script src="js/jquery.min.js"></script>
2   <!-- 最新的 Bootstrap 核心 JavaScript 文件 -->
3 <script type="text/javascript"  src="echarts/echarts.js"></script>
2)html,为柱状图设置容器
1 <body>
2       <div id="test" style="width:600px;height:400px;"></div>
3   </body>
3)js
<script type="text/javascript">
        // 路径配置
        require.config({
            paths: {
                echarts: '<%=basePath %>echarts'
            }
        });

        // 使用
        require(
            [
                'echarts',
                'echarts/chart/line',
                'echarts/chart/bar' // 使用柱状图就加载bar模块,按需加载
            ],
            function (ec) {
                // 基于准备好的dom,初始化echarts图表
                var myChart = ec.init(document.getElementById('test'));

      option = {
    title : {
        text: '农户地块面积统计'

    },
    tooltip : {
        trigger: 'axis'
    },
    legend: {
        data:['承保人']
    },
    toolbox: {
        show : true,
        feature : {
            mark : {show: true},
            dataView : {show: true, readOnly: false},
            magicType : {show: true, type: ['line', 'bar']},
            restore : {show: true},
            saveAsImage : {show: true}
        }
    },
    calculable : true,
    xAxis : [
        {
             type: 'category',
             data : (function(){
            var arr=[];
            $.ajax({
                 type : "post",
                 async : false, //同步执行
                 url : "gpadd.do?getNum",
                 data : {},
                dataType : "json", //返回数据形式为json
                 success : function(result) {
                   if (result) {
                        for(var i=0;i<result.length;i++){
                        console.log(result[i].userName);
                       arr.push(result[i].userName);
                     }
                   }

                },
                    error : function(errorMsg) {
                        alert("不好意思,图表请求数据失败啦!");
                         myChart.hideLoading();
                       }
               })
                 return arr;
              })() ,
               axisLabel:{
                         interval:0,//横轴信息全部显示
                         rotate:-30,//-30度角倾斜显示
                    }


        }
    ],
    yAxis : [

            {
              type: 'value',
              name: '面积',
              min: 0,
              max: 1000000,
              interval: 100,
              axisLabel: {
                  formatter: '{value} m2'
              },
              splitNumber:10
          },


    ],
    series : [
        {
            name:'承保人',
            type:'bar',
            data : (function(){
            var arr=[];
            $.ajax({
                 type : "post",
                 async : false, //同步执行
                 url : "gpadd.do?getNum",
                 data : {},
                dataType : "json", //返回数据形式为json
                 success : function(result) {
                   if (result) {
                        for(var i=0;i<result.length;i++){
                        console.log(result[i].landScmj);
                       arr.push(result[i].landScmj);
                     }
                   }

                },
                    error : function(errorMsg) {
                        alert("不好意思,图表请求数据失败啦!");
                         myChart.hideLoading();
                       }
               })
                 return arr;
              })()

        },

    ]
};
 // 为echarts对象加载数据
    myChart.setOption(option);

      }
  );
    </script>
红色部分的为用ajax来获取动态数据
4)后台实现
 1     @RequestMapping(params="getNum", produces = "application/json")
 2     public void getNum(HttpServletRequest request, HttpServletResponse response)
 3             throws ServletException, IOException {
 4
 5         response.setContentType("text/html; charset=utf-8");
 6         List<LandUser> list=new ArrayList<LandUser>();
 7         list=landUserBiz.findAll();
 8         JSONArray jsonArray = JSONArray.fromObject( list );//转化成json对象
 9            PrintWriter out=response.getWriter();
10            out.println(jsonArray);
11            out.flush();
12            out.close();
13
14     }
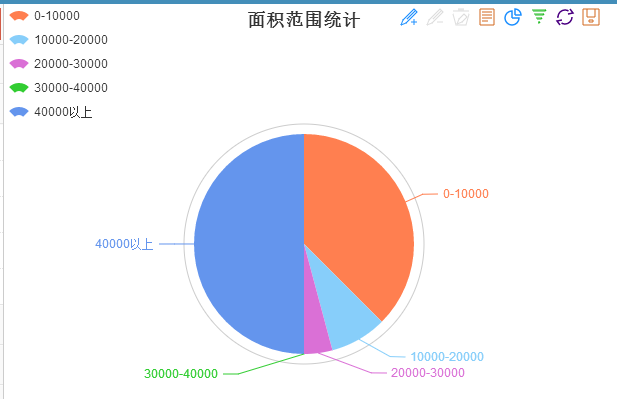
4.饼状图的实现
1)js
  1  <script type="text/javascript">
  2         // 路径配置
  3         require.config({
  4             paths: {
  5                 echarts: '<%=basePath %>echarts'
  6             }
  7         });
  8
  9         // 使用
 10         require(
 11             [
 12                 'echarts',
 13                 'echarts/chart/pie',// 使用柱状图就加载bar模块,按需加载
 14                 'echarts/chart/funnel'
 15             ],
 16             function (ec) {
 17                 // 基于准备好的dom,初始化echarts图表
 18                 var myChart = ec.init(document.getElementById('test'));
 19
 20              option = {
 21     title : {
 22         text: '面积范围统计',
 23         //subtext: '纯属虚构',
 24         x:'center'
 25     },
 26     tooltip : {
 27         trigger: 'item',
 28         formatter: "{a} <br/>{b} : {c} ({d}%)"
 29     },
 30     legend: {
 31         orient : 'vertical',
 32         x : 'left',
 33         data:['0-10000','10000-20000','20000-30000','30000-40000','40000以上']
 34     },
 35     toolbox: {
 36         show : true,
 37         feature : {
 38             mark : {show: true},
 39             dataView : {show: true, readOnly: false},
 40             magicType : {
 41                 show: true,
 42                 type: ['pie', 'funnel'],
 43                 option: {
 44                     funnel: {
 45                         x: '25%',
 46                         width: '50%',
 47                         funnelAlign: 'left',
 48                         max: 1548
 49                     }
 50                 }
 51             },
 52             restore : {show: true},
 53             saveAsImage : {show: true}
 54         }
 55     },
 56     calculable : true,
 57     series : [
 58         {
 59             name:'访问来源',
 60             type:'pie',
 61             radius : '55%',
 62             center: ['50%', '60%'],
 63             data : (function(){
 64             var arr=[];
 65             $.ajax({
 66                  type : "post",
 67                  async : false, //同步执行
 68                  url : "gpadd.do?getCount",
 69                  data : {},
 70                 dataType : "json", //返回数据形式为json
 71                  success : function(result) {
 72
 73
 74                    if (result) {
 75                         for(var i=0;i<result.listCont.length;i++){
 76
 77                        //alert(result.listCont[i]+" "+result.listName[i]);
 78                         arr.push({
 79                           name : result.listName[i],
 80                           value : result.listCont[i]
 81                         });
 82
 83                      }
 84                    }
 85
 86                 },
 87                     error : function(errorMsg) {
 88                         alert("不好意思,图表请求数据失败啦!");
 89                          myChart.hideLoading();
 90                        }
 91                })
 92                  return arr;
 93               })()
 94
 95         }
 96     ]
 97 };
 98
 99
100                 // 为echarts对象加载数据
101                 myChart.setOption(option);
102             }
103         );
104     </script>
2)后台
 1 @RequestMapping(params="getCount", produces = "application/json")
 2     public void getCount(HttpServletRequest request, HttpServletResponse response)
 3             throws ServletException, IOException {
 4
 5         response.setContentType("text/html; charset=utf-8");
 6         List<LandUser> list=new ArrayList<LandUser>();
 7         List<Integer>  listCont=new ArrayList<Integer>();
 8         List<String> listName=new ArrayList<String>();
 9
10         list=landUserBiz.findAll();
11        int count1=0,count2=0,count3=0,count4=0,count5=0;
12
13         for(LandUser lu:list){
14
15             if(lu.getLandScmj()>0&&lu.getLandScmj()<10000)
16                 count1++;
17             else if(lu.getLandScmj()>10000&&lu.getLandScmj()<20000)
18                 count2++;
19             else if(lu.getLandScmj()>20000&&lu.getLandScmj()<30000)
20                 count3++;
21             else if(lu.getLandScmj()>30000&&lu.getLandScmj()<40000)
22                 count4++;
23             else
24                  count5++;
25         }
26
27         listCont.add(count1);
28         listCont.add(count2);
29         listCont.add(count3);
30         listCont.add(count4);
31         listCont.add(count5);
32         listName.add("0-10000");
33         listName.add("10000-20000");
34         listName.add("20000-30000");
35         listName.add("30000-40000");
36         listName.add("40000以上");
37
38         PrintWriter out=response.getWriter();
39            JSONObject jsonData=new JSONObject();
40            jsonData.put("listCont",listCont);
41            jsonData.put("listName",listName);
42            out.println(jsonData);
43             out.flush();
44             out.close();
45     }
成果显示
柱状图:
饼状图:

 浙公网安备 33010602011771号