
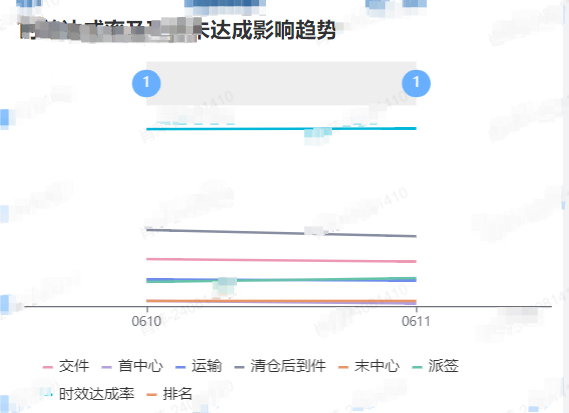
echrts 折线图实现数据排名展示
效果:
接口结构:
{
    "data": [
        {
            "tdtRank": 1,
            "tranTransferOvertimeRate": 0.0211,
            "outtranOpOvertimeRate": 0.0041,
            "siteDispSignOvertimeRate": 0.0190,
            "lastTranOptOvertimeRate": 0.0035,
            "sendOvertimeRate": 0.036800,
            "statDateStr": "0610",
            "manageAreaName": null,
            "ukOvertimeRate": 0.0604,
            "recDispTimeSuccessRate": 0.869300,
            "manageAreaCode": null
        },
        {
            "tdtRank": 1,
            "tranTransferOvertimeRate": 0.0199,
            "outtranOpOvertimeRate": 0.0019,
            "siteDispSignOvertimeRate": 0.0221,
            "lastTranOptOvertimeRate": 0.0039,
            "sendOvertimeRate": 0.035000,
            "statDateStr": "0611",
            "manageAreaName": null,
            "ukOvertimeRate": 0.0547,
            "recDispTimeSuccessRate": 0.871800,
            "manageAreaCode": null
        }
    ],
    "message": "操作成功",
    "statusCode": 200,
    "status": true
}
line组件配置
<script setup lang="ts">
import * as echarts from 'echarts';
import { onMounted, ref, reactive, defineProps } from 'vue';
import { useRouter } from 'vue-router';
import { formatPercent } from '@/utils/util';
import { withinCompletionRate, withinCompletionRateDetail } from '@/api/ageing';
import dayjs from 'dayjs';

const props = defineProps({
  type: {
    type: Number,
    default: 0
  }
});
const router = useRouter();
// @ts-ignore
let myChart = null;
const chartRef = ref();

const state = reactive({
  chartConfig: {}
});

const getAreaStyle = (type = 0) => {
  return {
    color: {
      type: 'linear',
      x: 0,
      y: 0,
      x2: 0,
      y2: 1,
      colorStops: [
        {
          offset: 0,
          color: type ? 'rgba(3, 183, 217, 0.3)' : 'rgba(16, 66, 223, 0.3)' // 100% 处的颜色
        },
        {
          offset: 1,
          color: '#FFFFFF' //   0% 处的颜色
        }
      ],
      global: false // 缺省为 false
    }
  };
};

const initECharts = (res: any) => {
  const colors = [
    '#ED99B4',
    '#B2A0DF',
    '#6F8DEB',
    '#888EA1',
    '#E79566',
    '#66C2AB',
    '#03B7D9',
    '#E79566',
    '#66C2AB',
    '#8C71CF',
    '#C52906',
    '#588C03'
  ];
  if (chartRef.value) {
    // @ts-ignore
    if (!myChart) {
      myChart = echarts.init(chartRef.value);
    }
    let series = [];
    let labels = [];
    let dates = [];
    let tooltip = {};

    let pointStyle = {
      borderColor: "#ea6f21",
      color: "#fff",
      borderWidth: 2,
    };
    let labelStyle = {
      show: true,
      position: "inside",
      lineHeight: 20,
      borderRadius: 50,
      backgroundColor: "rgba(105, 175, 255, 1)",
      borderColor: "rgba(105, 175, 255, 1)",
      borderWidth: "1",
      padding: [0, 7],
      color: "#fff",
      fontSize: 12,
      fontWeight: "normal",
      formatter: function () {
        return 1;
      },
    };
    let total = res.map((item: object) => {
      return {
        num: 100,
        value: item.tdtRank,
      }
    })

    let seriesData = [];
    total.forEach((item, index) => {
      let ob = {
        value: item.num,
        itemStyle: pointStyle,
        label: labelStyle,
      };
      if (total[index].value != 1) {
        ob.itemStyle = {
          borderColor: "#ea6f21",
          color: "#ea6f21",
          borderWidth: 3,
        };
        ob.label = {
          show: true,
          position: "inside",
          lineHeight: 20,
          backgroundColor: "red",
          borderRadius: 50,
          borderColor: "red",
          borderWidth: "1",
          padding: [0, 7],
          color: "#fff",
          fontSize: 12,
          fontWeight: "normal",
          formatter: function (value) {
            return item.value;
          },
        };
      }
      seriesData.push(ob);
    });

    series = [
      {
        name: '交件',
        type: 'line',
        symbolSize: 0,
        smooth: true,
        xAxisIndex: 1,
        yAxisIndex: 3,
        data: res.map((item: object) => formatPercent(item.sendOvertimeRate, 1, false))
      },
      {
        name: '首中心',
        type: 'line',
        symbolSize: 0,
        smooth: true,
        xAxisIndex: 1,
        yAxisIndex: 3,
        data: res.map((item: object) => formatPercent(item.outtranOpOvertimeRate, 1, false))
      },
      {
        name: '运输',
        type: 'line',
        symbolSize: 0,
        smooth: true,
        xAxisIndex: 1,
        yAxisIndex: 3,
        data: res.map((item: object) => formatPercent(item.tranTransferOvertimeRate, 1, false))
      },
      {
        name: '清仓后到件',
        type: 'line',
        symbolSize: 0,
        smooth: true,
        xAxisIndex: 1,
        yAxisIndex: 3,
        data: res.map((item: object) => formatPercent(item.ukOvertimeRate, 1, false))
      },
      {
        name: '末中心',
        type: 'line',
        symbolSize: 0,
        smooth: true,
        xAxisIndex: 1,
        yAxisIndex: 3,
        data: res.map((item: object) => formatPercent(item.lastTranOptOvertimeRate, 1, false))
      },
      {
        name: '派签',
        type: 'line',
        symbolSize: 0,
        smooth: true,
        xAxisIndex: 1,
        yAxisIndex: 3,
        data: res.map((item: object) => formatPercent(item.siteDispSignOvertimeRate, 1, false))
      },
      {
        name: '时效达成率',
        type: 'line',
        symbolSize: 0,
        smooth: true,
        xAxisIndex: 1,
        yAxisIndex: 2,
        data: res.map((item: object) => formatPercent(item.recDispTimeSuccessRate, 1, false))
      },
      {
        name: '排名',
        type: "line",
        xAxisIndex: 0,
        yAxisIndex: 0,
        showAllSymbol: true,
        hoverAnimation: false, // 悬浮的动画加上
        smooth: true, // 可选,平滑线
        symbolSize: 10,
        lineStyle: {
          normal: {
            color: "#eee",
            width: 35,
          },
          emphasis: {
            color: "#eee",
            focus: 'series' // 鼠标悬浮时,保持线条显示
          }
        },
        tooltip: {
          show: false,
        },
        data: seriesData,
      },
    ];

    tooltip = {
      show: true,
      trigger: 'axis',
      backgroundColor: 'rgba(0,0,0,0.7)',
      triggerOn: 'click',
      textStyle: {
        color: '#ffffff',
        fontSize: 12
      },
      borderColor: 'transparent',
      valueFormatter: (value: number | string) => value + '%'
    };
    dates = res.map((item: object) => item.statDateStr);
    labels = series.map((item: object) => item.name);
    const option = {
      color: colors,
      title: {
        show: false,
        text: '时效达成率及环节未达成影响趋势',
        left: 10,
        textStyle: {
          color: '#303133',
          fontWeight: 500
        },
        padding: [5, 10, 40, 0]
      },
      grid: [
        // 配置第一个折线图的位置
        {
          left: 10,
          right: 10,
          top: "10%",
          bottom: '20%',
          height: "30",
        },
        // 配置第二个折线图位置
        {
          left: 10,
          right: 10,
          top: "22%",
          height: "160",
          containLabel: true
        },
      ],
      legend: {
        data: labels,
        bottom: 10,
        left: 30,
        right: 30,
        icon: 'rect',
        itemWidth: 8,
        itemHeight: 2,
        selected: {}
      },
      tooltip: tooltip,
      // 将上下两个tootip合成一个
      axisPointer: {
        link: { xAxisIndex: "all" },
      },
      xAxis: [
        {
          type: "category",
          scale: true,
          axisLabel: {
            //坐标轴刻度标签的相关设置。
            show: false,
          },
          axisTick: {
            //坐标轴刻度相关设置。
            show: false,
          },
          axisLine: {
            show: false,
          },
          splitLine: {
            //坐标轴在 grid 区域中的分隔线。
            show: false,
          },
          data: dates
        },
        {
          gridIndex: 1,
          type: "category",
          scale: true,
          axisLabel: {
            fontSize: 10,
          },
          axisTick: {
            alignWithLabel: true,
          },
          splitLine: {
            show: false,
          },
          data: dates
        },
      ],
      yAxis: [
        {
          type: "value",
          axisLabel: {
            //坐标轴刻度标签的相关设置。
            show: false,
          },
          axisTick: {
            //坐标轴刻度相关设置。
            show: false,
          },
          axisLine: {
            show: false,
          },
          splitLine: {
            //坐标轴在 grid 区域中的分隔线。
            show: false,
          },
        },
        {
          type: "value",
          scale: true,
          gridIndex: 1,
          // min: 'dataMin',
          min: '0',
          max: 'dataMax',
          axisLabel: {
            //坐标轴刻度标签的相关设置。
            show: false,
          },
          axisTick: {
            //坐标轴刻度相关设置。
            show: false,
          },
          axisLine: {
            show: false,
          },
          splitLine: {
            //坐标轴在 grid 区域中的分隔线。
            show: false,
          },
          splitNumber: 3,
        },
        {
          type: 'value',
          scale: true,
          gridIndex: 1,
          max: function (value: object) {
            return value.max + 8;
          },
          axisLabel: {
            //坐标轴刻度标签的相关设置。
            show: false,
          },
          axisTick: {
            //坐标轴刻度相关设置。
            show: false,
          },
          axisLine: {
            show: false,
          },
          splitLine: {
            //坐标轴在 grid 区域中的分隔线。
            show: false,
          },
          splitNumber: 3,
        },
      ],
      dataZoom: [
        {
          type: 'inside',
          startValue: dates.length > 7 ? dates[dates.length - 7] : '',
          xAxisIndex: [0, 1], // 显示 0 1 的数据,这个要加,不加的话,悬浮提示就会出问题
        },
        {
          show: dates.length > 7,
          startValue: dates.length > 7 ? dates[dates.length - 7] : '',
          xAxisIndex: [0, 1], // 显示 0 1 的数据,这个要加,不加的话,悬浮提示就会出问题
          brushSelect: false,
          type: 'slider',
          bottom: '60',
          zoomLock: false,
          backgroundColor: '#f5f5f5',
          dataBackground: {
            lineStyle: {
              color: '#f5f5f5'
            },
            areaStyle: {
              color: '#f5f5f5'
            }
          },
          fillerColor: '#ddd',
          borderColor: '#f5f5f5',
          handleSize: '0%',
          moveHandleSize: 0,
          showDetail: false,
          height: 8
        }
      ],
      series: series
    };
    // @ts-ignore
    state.chartConfig = option;
    myChart && myChart.setOption(state.chartConfig);
    myChart.on('legendselectchanged', function (params: any) {
      let option = state.chartConfig;
      option.legend.selected[params.name] = true;
      myChart.setOption(option);
    });
  }
};

const query = () => {
  const params = {};
  let api = withinCompletionRateDetail;
  const { warnDate, kpiManageAreaCode, kpiZbCode } = router.currentRoute.value.query;
  params.manageAreaCode = kpiManageAreaCode;
  params.typeOfInAndOut = kpiZbCode === 'line_achieve_in' ? 1 : 2; // 进出港类型: 0不区分, 1进港,2 出港
  params.statDateStr = dayjs(warnDate).format('YYYY-MM-DD');
  api(params).then((res: any) => {
    if (res.length) {
      initECharts(res);
    }
  });
};

onMounted(() => {
  // if (self != top) {
  //   myChart &&
  //     myChart.resize({
  //       width: 320,
  //       height: 300
  //     });
  // }
  query();
});
</script>

<template>
  <div ref="lineBox" class="line-box">
    <div class="title">时效达成率及环节未达成影响趋势</div>
    <div ref="chartRef" class="line-echarts"></div>
  </div>
</template>

<style scoped lang="scss">
.line-box {
  background: #fff;
  border-radius: 8px;
  color: #303133;
  padding-top: 16px;

  .title {
    font-size: 17px;
    font-weight: 600;
    padding-left: 16px;
  }

  .line-echarts {
    width: 100%;
    height: 300px;
  }
}
</style>
option全部代码
option = {
  color: [
    "#ED99B4",
    "#B2A0DF",
    "#6F8DEB",
    "#888EA1",
    "#E79566",
    "#66C2AB",
    "#03B7D9",
    "#E79566",
    "#66C2AB",
    "#8C71CF",
    "#C52906",
    "#588C03",
  ],
  title: {
    show: false,
    text: "时效达成率及环节未达成影响趋势",
    left: 10,
    textStyle: { color: "#303133", fontWeight: 500 },
    padding: [5, 10, 40, 0],
  },
  grid: [
    { left: 10, right: 10, top: "10%", bottom: "20%", height: "30" },
    { left: 10, right: 10, top: "22%", height: "160", containLabel: true },
  ],
  legend: {
    data: [
      "交件",
      "首中心",
      "运输",
      "清仓后到件",
      "末中心",
      "派签",
      "时效达成率",
      "排名",
    ],
    bottom: 10,
    left: 30,
    right: 30,
    icon: "rect",
    itemWidth: 8,
    itemHeight: 2,
    selected: {},
  },
  tooltip: {
    show: true,
    trigger: "axis",
    backgroundColor: "rgba(0,0,0,0.7)",
    triggerOn: "click",
    textStyle: { color: "#ffffff", fontSize: 12 },
    borderColor: "transparent",
    valueFormatter: {
      _custom: {
        type: "function",
        display:
          '<span style="opacity:.5;">function</span> valueFormatter(value)',
        tooltip: '<pre>(value) => value + "%"</pre>',
        _reviveId: 1417,
      },
    },
  },
  axisPointer: { link: { xAxisIndex: "all" } },
  xAxis: [
    {
      type: "category",
      scale: true,
      axisLabel: { show: false },
      axisTick: { show: false },
      axisLine: { show: false },
      splitLine: { show: false },
      data: ["0610", "0611"],
    },
    {
      gridIndex: 1,
      type: "category",
      scale: true,
      axisLabel: { fontSize: 10 },
      axisTick: { alignWithLabel: true },
      splitLine: { show: false },
      data: ["0610", "0611"],
    },
  ],
  yAxis: [
    {
      type: "value",
      axisLabel: { show: false },
      axisTick: { show: false },
      axisLine: { show: false },
      splitLine: { show: false },
    },
    {
      type: "value",
      axisLabel: { show: false },
      axisTick: { show: false },
      axisLine: { show: false },
      splitLine: { show: false },
    },
    {
      type: "value",
      scale: true,
      gridIndex: 1,
      min: "0",
      max: "dataMax",
      axisLabel: { show: false },
      axisTick: { show: false },
      axisLine: { show: false },
      splitLine: { show: false },
      splitNumber: 3,
    },
    {
      type: "value",
      scale: true,
      gridIndex: 1,
      max: {
        _custom: {
          type: "function",
          display: '<span style="opacity:.5;">function</span> max(value)',
          tooltip:
            "<pre>function(value) {\n                return value.max + 8;\n              }</pre>",
          _reviveId: 1418,
        },
      },
      axisLabel: { show: false },
      axisTick: { show: false },
      axisLine: { show: false },
      splitLine: { show: false },
      splitNumber: 3,
    },
  ],
  dataZoom: [
    { type: "inside", startValue: "", xAxisIndex: [0, 1] },
    {
      show: false,
      startValue: "",
      xAxisIndex: [0, 1],
      brushSelect: false,
      type: "slider",
      bottom: "60",
      zoomLock: false,
      backgroundColor: "#f5f5f5",
      dataBackground: {
        lineStyle: { color: "#f5f5f5" },
        areaStyle: { color: "#f5f5f5" },
      },
      fillerColor: "#ddd",
      borderColor: "#f5f5f5",
      handleSize: "0%",
      moveHandleSize: 0,
      showDetail: false,
      height: 8,
    },
  ],
  series: [
    {
      name: "交件",
      type: "line",
      symbolSize: 0,
      smooth: true,
      xAxisIndex: 1,
      yAxisIndex: 3,
      data: [3.7, 3.5],
    },
    {
      name: "首中心",
      type: "line",
      symbolSize: 0,
      smooth: true,
      xAxisIndex: 1,
      yAxisIndex: 3,
      data: [0.4, 0.2],
    },
    {
      name: "运输",
      type: "line",
      symbolSize: 0,
      smooth: true,
      xAxisIndex: 1,
      yAxisIndex: 3,
      data: [2.1, 2],
    },
    {
      name: "清仓后到件",
      type: "line",
      symbolSize: 0,
      smooth: true,
      xAxisIndex: 1,
      yAxisIndex: 3,
      data: [6, 5.5],
    },
    {
      name: "末中心",
      type: "line",
      symbolSize: 0,
      smooth: true,
      xAxisIndex: 1,
      yAxisIndex: 3,
      data: [0.4, 0.4],
    },
    {
      name: "派签",
      type: "line",
      symbolSize: 0,
      smooth: true,
      xAxisIndex: 1,
      yAxisIndex: 3,
      data: [1.9, 2.2],
    },
    {
      name: "时效达成率",
      type: "line",
      symbolSize: 0,
      smooth: true,
      xAxisIndex: 1,
      yAxisIndex: 2,
      data: [86.9, 87.2],
    },
    {
      name: "排名",
      type: "line",
      xAxisIndex: 0,
      yAxisIndex: 0,
      showAllSymbol: true,
      hoverAnimation: false,
      smooth: true,
      symbolSize: 10,
      lineStyle: {
        normal: { color: "#eee", width: 35 },
        emphasis: { color: "#eee", focus: "series" },
      },
      tooltip: { show: false },
      data: [
        {
          value: 100,
          itemStyle: { borderColor: "#ea6f21", color: "#fff", borderWidth: 2 },
          label: {
            show: true,
            position: "inside",
            lineHeight: 20,
            borderRadius: 50,
            backgroundColor: "rgba(105, 175, 255, 1)",
            borderColor: "rgba(105, 175, 255, 1)",
            borderWidth: "1",
            padding: [0, 7],
            color: "#fff",
            fontSize: 12,
            fontWeight: "normal",
            formatter: {
              _custom: {
                type: "function",
                display:
                  '<span style="opacity:.5;">function</span> formatter()',
                tooltip:
                  "<pre>function() {\n            return 1;\n          }</pre>",
                _reviveId: 1419,
              },
            },
          },
        },
      ],
    },
  ],
};

 浙公网安备 33010602011771号