

adb命令——adb shell top命令
adb shell top
top命令提供了实时的对系统处理器的状态监视.它将显示系统中CPU最“敏感”的任务列表.该命令可以按CPU使用.内存使用和执行时间对任务进行排序.
top 用法
>adb shell top -h
Usage: top [ -m max_procs ] [ -n iterations ] [ -d delay ] [ -s sort_column ] [-t ] [ -h ]
-m num Maximum number of processes to display. 最多显示多少个进程
-n num Updates to show before exiting. 刷新次数
-d num Seconds to wait between updates. 刷新间隔时间(默认5秒)
-s col Column to sort by (cpu,vss,rss,thr). 按哪列排序
-t Show threads instead of processes. 显示线程信息而不是进程
-h Display this help screen. 显示帮助文档
adb shell top
> adb shell top
User 13%, System 5%, IOW 0%, IRQ 0%
User 85 + Nice 0 + Sys 37 + Idle 509 + IOW 0 + IRQ 0 + SIRQ 0 = 631
PID PR CPU% S #THR VSS RSS PCY UID Name
22205 0 13% S 56 423416K 88160K fg u0_a92 com.tmall.wireless
24310 1 2% R 1 1232K 536K root top
22600 0 1% S 46 341712K 40872K fg u0_a90 com.wandoujia.phoenix2.usbproxy
31125 1 1% S 31 319976K 33284K fg u0_a74 com.android.Chinpower
1533 0 1% S 32 67320K 20552K fg system /system/bin/surfaceflinger
1852 0 1% S 112 445876K 80304K fg system system_server
...
10 0 0% S 1 0K 0K root watchdog/0
16 1 0% S 1 0K 0K root khelper
22 1 0% S 1 0K 0K root suspend_sys_syn
23 1 0% S 1 0K 0K root suspend
第一组数据的含义:
User 处于用户态的运行时间,不包含优先值为负进程
Nice 优先值为负的进程所占用的CPU时间
Sys 处于核心态的运行时间
Idle 除IO等待时间以外的其它等待时间
IOW IO等待时间
IRQ 硬中断时间
SIRQ 软中断时间
第二组数据的含义:
PID 进程id
PR 优先级
CPU% 当前瞬时CPU占用率
S 进程状态:D=不可中断的睡眠状态, R=运行, S=睡眠, T=跟踪/停止, Z=僵尸进程
#THR 程序当前所用的线程数
VSS Virtual Set Size 虚拟耗用内存(包含共享库占用的内存)
RSS Resident Set Size 实际使用物理内存(包含共享库占用的内存)
PCY 调度策略优先级,SP_BACKGROUND/SP_FOREGROUND
UID 进程所有者的用户id
Name 进程的名称
具体信息可以查看源代码中: xx\system\core\toolbox\top.c
监控CPU的命令使用实战
>adb shell top | findstr tmall > d:\cpu.txt
打印 top命令,并查找 包含 tmall的命令行,输出至 d:\cpu.txt
result:
22137 1 0% S 10 304728K 28900K bg u0_a92 com.tmall.wireless:push
22205 0 0% S 15 322944K 38236K bg u0_a92 com.tmall.wireless
22205 1 27% R 34 345304K 49396K fg u0_a92 com.tmall.wireless
22112 1 0% S 9 303704K 29380K bg u0_a92 com.tmall.wireless:containerprocess1
22137 1 0% S 10 304728K 28900K bg u0_a92 com.tmall.wireless:push
22252 1 0% S 9 302600K 28596K fg u0_a92 com.tmall.wireless:notify
22205 0 45% R 40 365500K 56708K fg u0_a92 com.tmall.wireless
22252 0 22% S 19 325476K 40868K bg u0_a92 com.tmall.wireless:notify
22137 0 2% S 14 308944K 31320K fg u0_a92 com.tmall.wireless:push
22112 0 0% S 9 305892K 29888K bg u0_a92 com.tmall.wireless:containerprocess1
22137 1 14% S 17 323080K 39696K bg u0_a92 com.tmall.wireless:push
22252 0 3% S 21 327656K 41556K bg u0_a92 com.tmall.wireless:notify
22205 1 2% S 38 366420K 59700K fg u0_a92 com.tmall.wireless
22112 0 0% S 9 305892K 29888K bg u0_a92 com.tmall.wireless:containerprocess1
22408 0 0% R 9 278424K 21936K fg u0_a92 com.tmall.wireless:utremote
22408 1 7% S 9 304180K 30964K bg u0_a92 com.tmall.wireless:utremote
22205 0 2% R 39 367456K 59612K fg u0_a92 com.tmall.wireless
==================================================================================================
adb shell top
一、其中相关参数:
-
>adb shell top -h
-
Usage: top [ -m max_procs ] [ -n iterations ] [ -d delay ] [ -s sort_column ] [-t ] [ -h ]
-
-m num Maximum number of processes to display. 最多显示多少个进程
-
-n num Updates to show before exiting. 刷新次数
-
-d num Seconds to wait between updates. 刷新间隔时间(默认5秒)
-
-s col Column to sort by (cpu,vss,rss,thr). 按哪列排序
-
-t Show threads instead of processes. 显示线程信息而不是进程
-
-h Display this help screen. 显示帮助文档
比如:
adb shell top -m 5
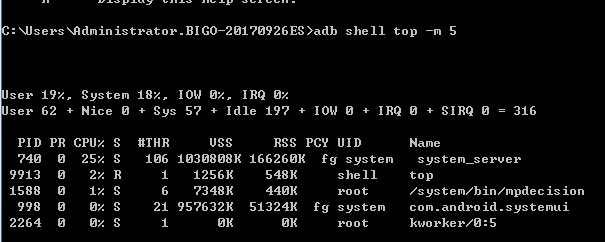
表示打印出5个进程数,以及相关进程运行所消耗的CPU值百分比。
第一栏相关参数解释:
-
User 处于用户态的运行时间,不包含优先值为负进程
-
Nice 优先值为负的进程所占用的CPU时间
-
Sys 处于核心态的运行时间
-
Idle 除IO等待时间以外的其它等待时间
-
IOW IO等待时间
-
IRQ 硬中断时间
-
SIRQ 软中断时间PID 进程id
第二栏相关参数解释:
-
PID 进程id
-
PR 优先级
-
CPU% 当前瞬时CPU占用率
-
S 进程状态:D=不可中断的睡眠状态, R=运行, S=睡眠, T=跟踪/停止, Z=僵尸进程
-
#THR 程序当前所用的线程数
-
VSS Virtual Set Size 虚拟耗用内存(包含共享库占用的内存)
-
RSS Resident Set Size 实际使用物理内存(包含共享库占用的内存)
-
PCY 调度策略优先级,SP_BACKGROUND/SP_FOREGROUND
-
UID 进程所有者的用户id
-
Name 进程的名称
二、命令使用
- adb shell top -m xx 查看XX个进程数
- adb shell top -n XX 刷新XX次
- adb shell top -d XX 刷新频率
- ……
三、打印出来的数据保存到本地
adb shell top -m 5 > d:\cpu.txt 表示打印的5个进程的数据保存到本地D盘的cpu.txt文件中
四、指定查看某个应用的数据
例如: 监测一次微博的CPU占用情况:adb shell top -n 1 | grep com.sina.weibo
10秒刷新一次显示CPU占用情况:adb shell top -d 10 | grep com.sina.weibo
实时监测微博的CPU占用情况:adb shell top |grep com.sina.weibo

 浙公网安备 33010602011771号