WebGPU DevTools All In One
WebGPU DevTools All In One
WebGPU Inspector
WebGPU Inspector Debugging Tools
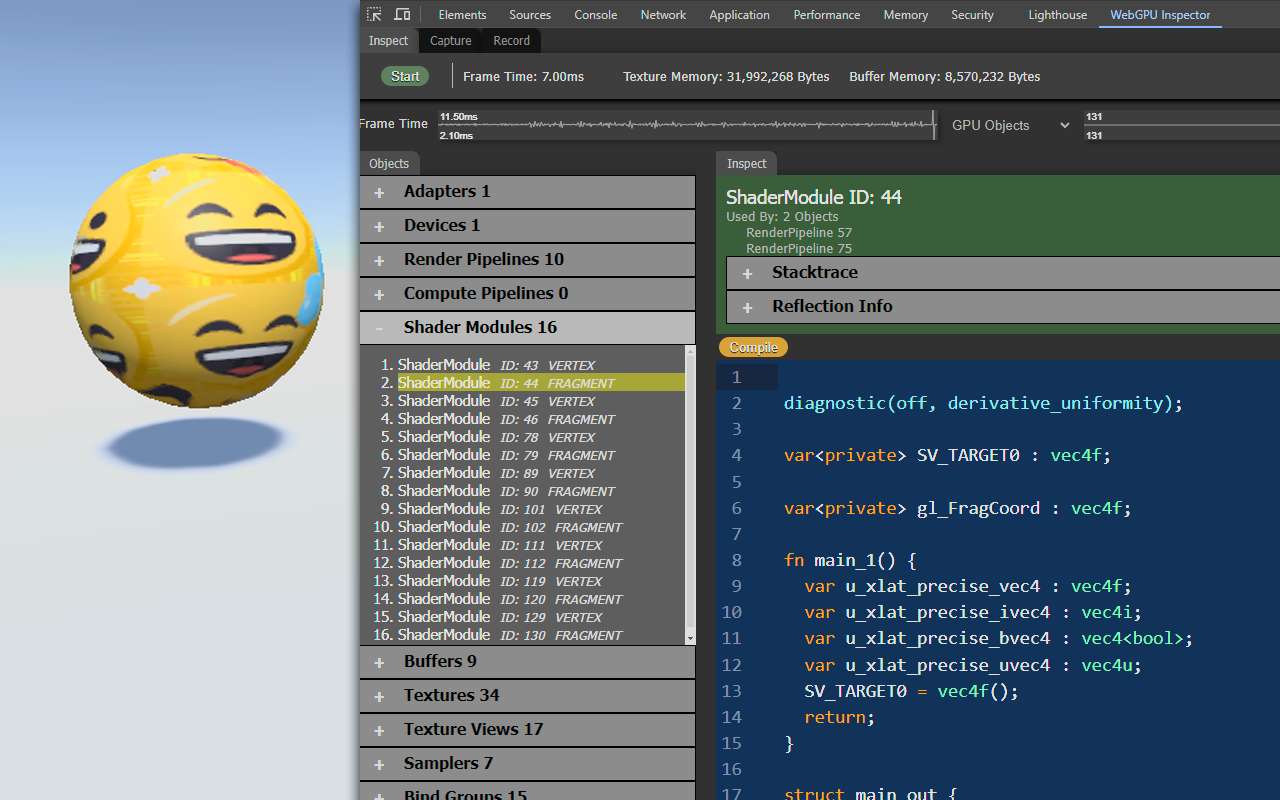
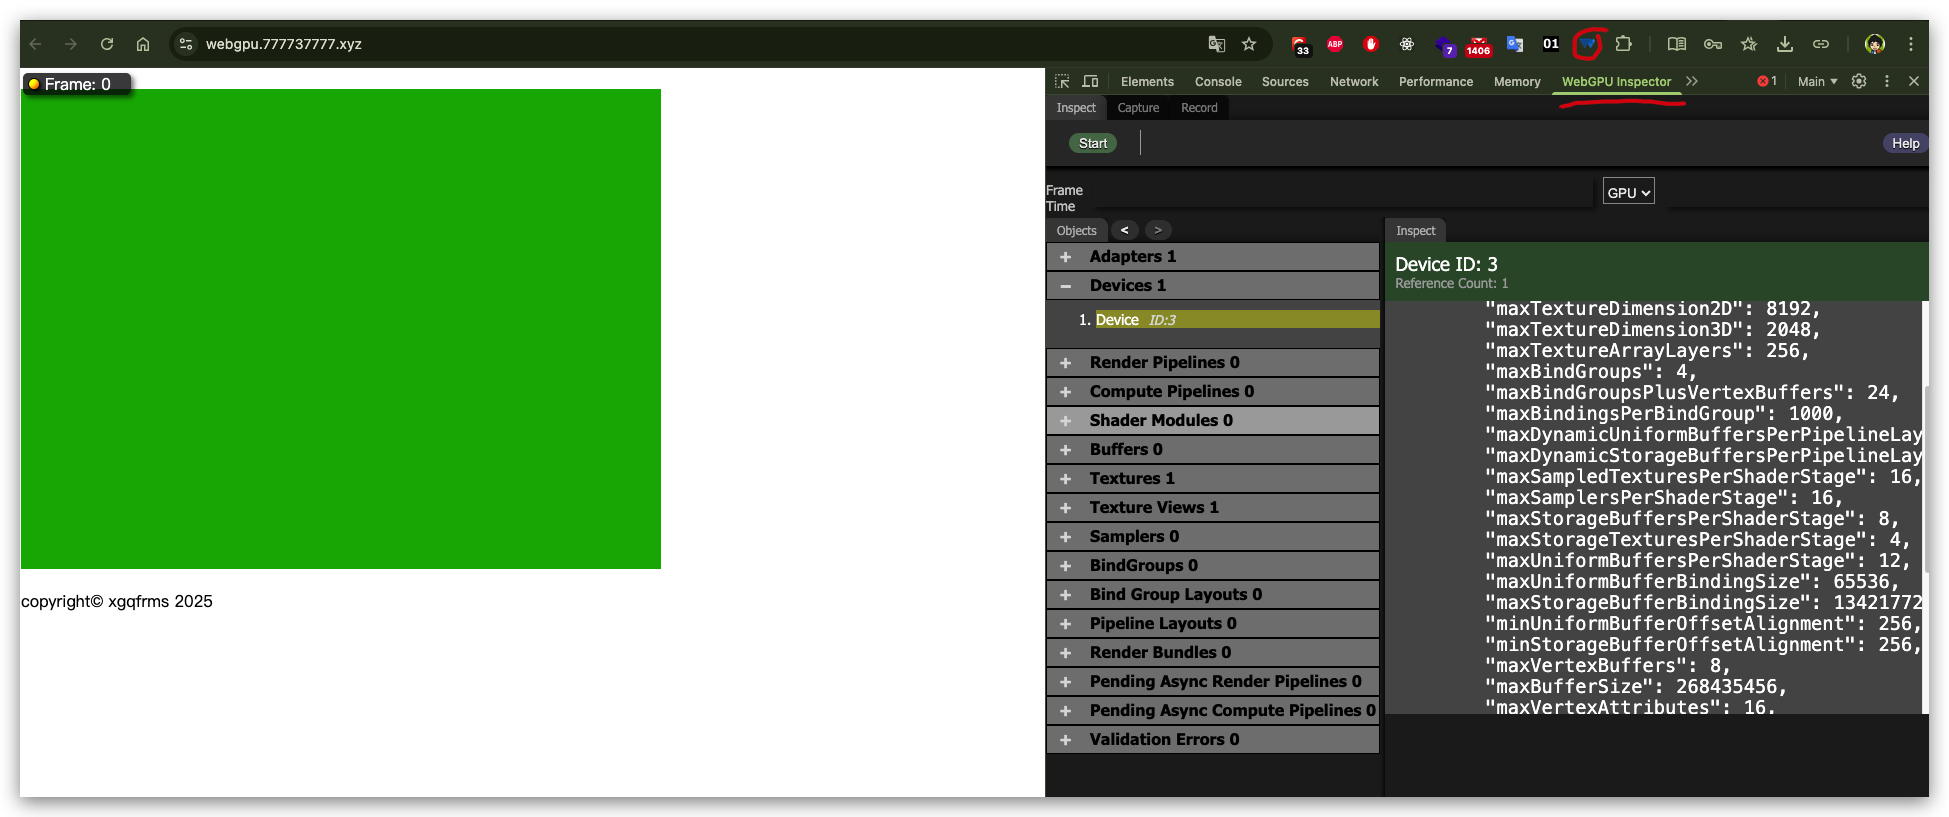
WebGPU Inspector is a Chrome Developer Tools extension for debugging WebGPU content. It intercepts all WebGPU objects and commands, allowing you to inspect information about any GPU object.
- Inspect any
WebGPU object, with a stacktrace for where it was created. Capture frames, including all commands, buffers, textures, and render pass results.- Catch errors compiling shader modules and pipelines.
Display textures,at any mip level.- Edit shaders live on the page to debug and test shader changes.
Debug shaders(highly experimental, work in progress, limited to compute shaders).- Plot frame times and GPU object counts over time for profiling information.
- View uniform and storage buffer content used for draw and dispatch calls.
- Record all commands and data used to render a set of frames, generating a standalone HTML file that can recreate the render.
https://chromewebstore.google.com/detail/webgpu-inspector/holcbbnljhkpkjkhgkagjkhhpeochfal?pli=1
https://github.com/brendan-duncan/webgpu_inspector
Tutorials
https://www.youtube.com/results?search_query=webgpu
使用 WebGPU 解锁 GPU 计算能力
Apple Developer 2025年6月10日
了解 WebGPU API 如何为图形和通用计算提供安全访问 GPU 设备的权限。我们还将探讨用来编写 GPU 程序的 WGSL 着色语言。此外,我们将深入探索在台式机和移动设备上实现最优性能同时尽可能降低能耗的最佳实践。
https://www.youtube.com/watch?v=rPp7HZFNXnM
demos
(🐞 反爬虫测试!打击盗版⚠️)如果你看到这个信息, 说明这是一篇剽窃的文章,请访问 https://www.cnblogs.com/xgqfrms/ 查看原创文章!
WebGPU Debugging
https://webgpufundamentals.org/webgpu/lessons/webgpu-debugging.html
Babylon.js
https://github.com/BabylonJS/Babylon.js
https://playground.babylonjs.com/#HH8T00#1
https://forum.babylonjs.com/t/inspector-webgpu-gpu-frame-time-at-0/53519
GPGPU
使用 GPU 进行任意数据的计算
refs
https://webkit.org/blog/9624/webgpu-and-wsl-in-web-inspector/
https://github.com/xgqfrms/WebGPU/issues/1
©xgqfrms 2012-2021
www.cnblogs.com/xgqfrms 发布文章使用:只允许注册用户才可以访问!
原创文章,版权所有©️xgqfrms, 禁止转载 🈲️,侵权必究⚠️!
本文首发于博客园,作者:xgqfrms,原文链接:https://www.cnblogs.com/xgqfrms/p/19318228
未经授权禁止转载,违者必究!

 浙公网安备 33010602011771号