import tensorflow as tf
import numpy as np
import matplotlib.pyplot as plt
from sklearn import datasets
import random
from PIL import Image
from tensorflow.examples.tutorials.mnist import input_data
sess=tf.Session()
mnist= input_data.read_data_sets("MNIST_data/",one_hot=True)
#本例包含10个类别
train_size=1000
test_size=102
rand_train_indices=np.random.choice(len(mnist.train.images),train_size,replace=False)
rand_test_indices=np.random.choice(len(mnist.train.images),test_size,replace=False)
x_vals_train=mnist.train.images[rand_train_indices]
x_vals_test=mnist.train.images[rand_test_indices]
y_vals_train=mnist.train.labels[rand_train_indices]
y_vals_test=mnist.train.labels[rand_test_indices]
k=4
batch_size=6
x_data_train=tf.placeholder(shape=[None,784],dtype=tf.float32)
x_data_test=tf.placeholder(shape=[None,784],dtype=tf.float32)
y_target_train=tf.placeholder(shape=[None,10],dtype=tf.float32)
y_target_test=tf.placeholder(shape=[None,10],dtype=tf.float32)
#L1距离 shape=(6, 1000) sub.shape=(1000,784) - (6,1,10)=(6,1000,784)
distance=tf.reduce_sum(tf.abs(tf.subtract(x_data_train,tf.expand_dims(x_data_test,1))),reduction_indices=2)
#top K (6, 4)
top_k_xvals,top_k_indices=tf.nn.top_k(tf.negative(distance),k=k)
#(6, 4, 10) = gather((1000,10),(6,4) )
prediction_indices=tf.gather(y_target_train,top_k_indices)
#shape=(6, 10)
count_of_prediction=tf.reduce_sum(prediction_indices,reduction_indices=1)
#预测模型 shape=(6,)
prediction=tf.arg_max(count_of_prediction,dimension=1)
num_loop=int(np.ceil(len(x_vals_test)/batch_size))
test_output=[]
actual_vals=[]
for i in range(num_loop):
min_index=i*batch_size
max_index=min((i+1)*batch_size,len(x_vals_test))
#获取数据
x_batch=x_vals_test[min_index:max_index]
y_batch = y_vals_test[min_index:max_index]
predictions=sess.run(prediction,feed_dict={x_data_test:x_batch,x_data_train:x_vals_train,y_target_test:y_batch,y_target_train:y_vals_train})
test_output.extend(predictions)
actual_vals.extend(np.argmax(y_batch,axis=1))
#精确度预测
accuracy=sum( 1./test_size for i in range(test_size) if test_output[i]==actual_vals[i])
print("Accuarcy: "+str(accuracy))
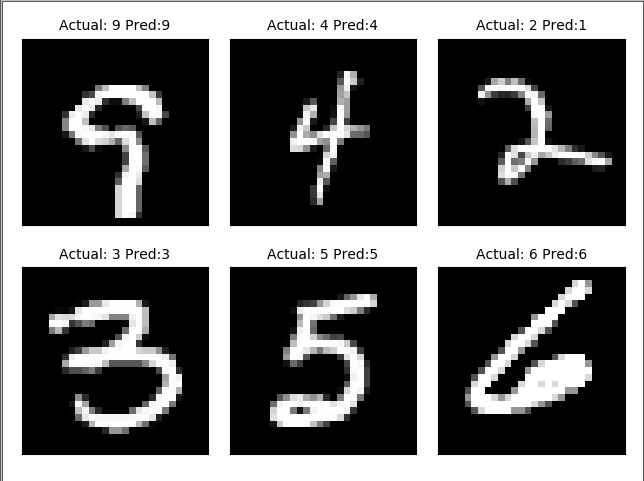
actuals=np.argmax(y_batch,axis=1)
for i in range(len(actuals)):
plt.subplot(2,3,i+1)
plt.imshow(np.reshape(x_batch[i],[28,28]),cmap="Greys_r")
plt.title('Actual: '+str(actuals[i])+' Pred:'+str(predictions[i]),fontsize=10)
frame=plt.gca()
frame.axes.get_xaxis().set_visible(False)
frame.axes.get_yaxis().set_visible(False)
plt.show()


 浙公网安备 33010602011771号