关于k Line Chart (k线图)
K Line Chart
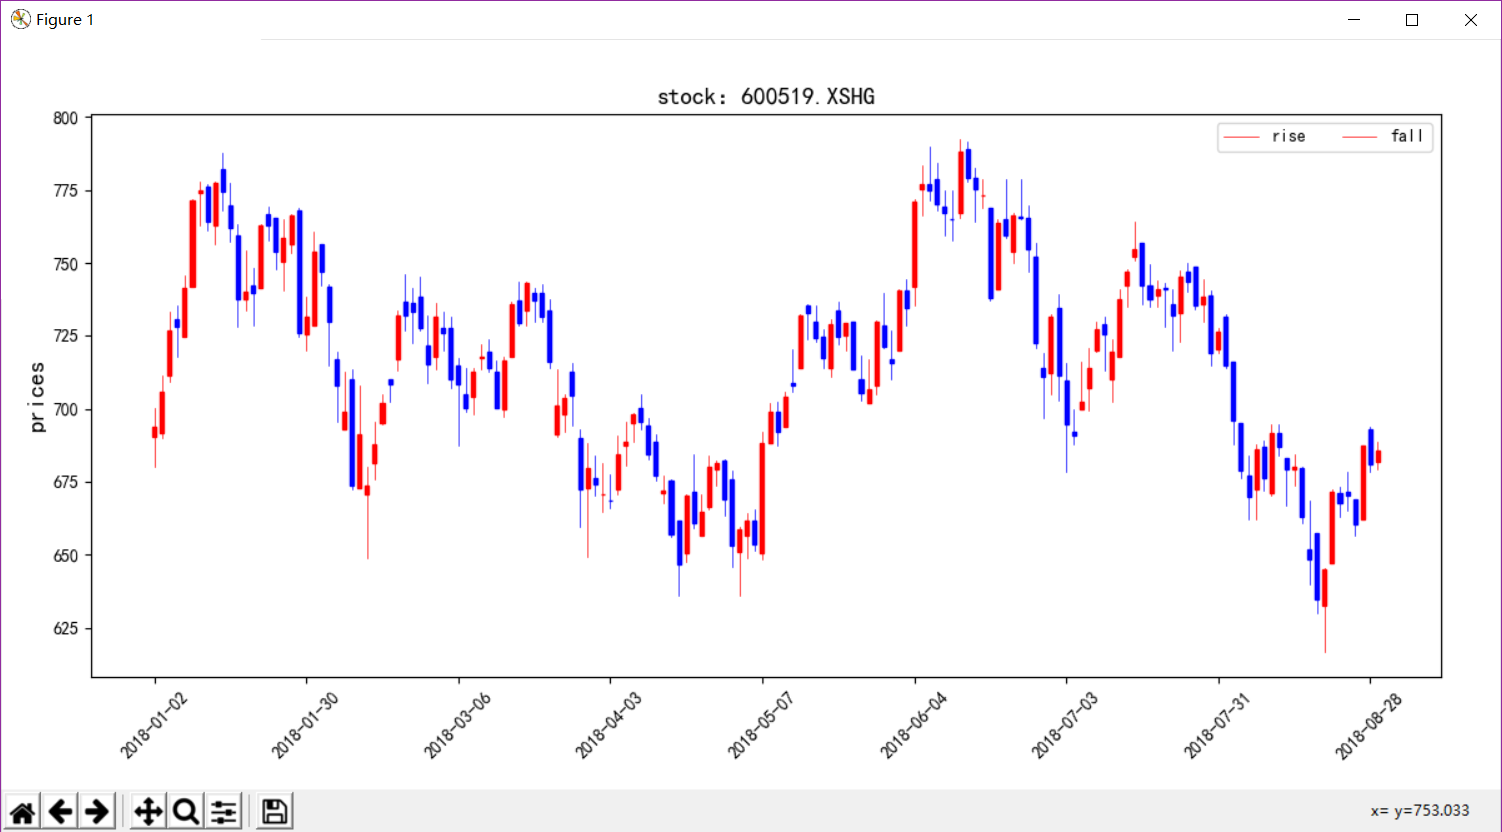
python实现k线图的代码,之前找过matplotlib中文文档但是画k线图的finance方法已经弃用了。所以自己在网上搜寻一下加上改编,很好的实现出k线图,
代码如下:__main__
# conding:utf-8
# 导入聚宽函数库
from jqdatasdk import *
import pandas as pd
import matplotlib.pyplot as plt
from KLineChart.mpl_finance import plt_KLineChart
import os

'''
:param fields 字符串list, 默认是None(表示['open', 'close', 'high', 'low', 'volume', 'money']这几个标准字段),
      支持以下属性 ['open', 'close', 'low', 'high', 'volume', 'money', 'factor', 'high_limit', 'low_limit', 'avg', 'pre_close', 'paused']
:param skip_paused 是否跳过不交易日期
'''
auth('your ID','your password')

fields = ['open', 'close', 'high', 'low', 'volume', 'money']
stock_code = ['600519.XSHG','000001.XSHE','IC9999.CCFX']
data = get_price(stock_code,start_date='2018-1-1',end_date='2018-8-29',frequency='1d',fields=fields,skip_paused=False)
k,m,n = data.shape
# print(k,m,n)
for i in range(n):
    Data = data.iloc[:,:,i]
    plt_KLineChart(Data,stock_code[i],step=20,fontSize=14)
plt.show()

# 数据保存
# os.mkdir('data/中国银行.xlsx')
# data.to_excel(r'./data/中国银行.xlsx')
# sql.to_excel()
# print(data.shape)
这下我们需要导入自定义函数:from mpl_finance import plt_KLineChart
"""
A collection of functions for analyzing and plotting
financial data. User contributions welcome!
"""
from
__future__
import
(absolute_import, division, print_function,
unicode_literals)
import
numpy as np
import
matplotlib.pyplot as plt
from
matplotlib
import
colors as mcolors
from
matplotlib.collections
import
LineCollection, PolyCollection
from
matplotlib.lines
import
TICKLEFT, TICKRIGHT, Line2D
from
matplotlib.patches
import
Rectangle
from
matplotlib.transforms
import
Affine2D
from
six.moves
import
xrange, zip
def
plot_day_summary_oclh(ax, quotes, ticksize=3
,
colorup
=
'
k
'
, colordown=
'
r
'
):
"""
Plots day summary
Represent the time, open, close, high, low as a vertical line
ranging from low to high. The left tick is the open and the right
tick is the close.
Parameters
----------
ax : `Axes`
an `Axes` instance to plot to
quotes : sequence of (time, open, close, high, low, ...) sequences
data to plot. time must be in float date format - see date2num
ticksize : int
open/close tick marker in points
colorup : color
the color of the lines where close >= open
colordown : color
the color of the lines where close < open
Returns
-------
lines : list
list of tuples of the lines added (one tuple per quote)
"""
return
_plot_day_summary(ax, quotes, ticksize=
ticksize,
colorup
=colorup, colordown=
colordown,
ochl
=
True)
def
plot_day_summary_ohlc(ax, quotes, ticksize=3
,
colorup
=
'
k
'
, colordown=
'
r
'
):
"""
Plots day summary
Represent the time, open, high, low, close as a vertical line
ranging from low to high. The left tick is the open and the right
tick is the close.
Parameters
----------
ax : `Axes`
an `Axes` instance to plot to
quotes : sequence of (time, open, high, low, close, ...) sequences
data to plot. time must be in float date format - see date2num
ticksize : int
open/close tick marker in points
colorup : color
the color of the lines where close >= open
colordown : color
the color of the lines where close < open
Returns
-------
lines : list
list of tuples of the lines added (one tuple per quote)
"""
return
_plot_day_summary(ax, quotes, ticksize=
ticksize,
colorup
=colorup, colordown=
colordown,
ochl
=
False)
def
_plot_day_summary(ax, quotes, ticksize=3
,
colorup
=
'
k
'
, colordown=
'
r
'
,
ochl
=
True):
"""
Plots day summary
Represent the time, open, high, low, close as a vertical line
ranging from low to high. The left tick is the open and the right
tick is the close.
Parameters
----------
ax : `Axes`
an `Axes` instance to plot to
quotes : sequence of quote sequences
data to plot. time must be in float date format - see date2num
(time, open, high, low, close, ...) vs
(time, open, close, high, low, ...)
set by `ochl`
ticksize : int
open/close tick marker in points
colorup : color
the color of the lines where close >= open
colordown : color
the color of the lines where close < open
ochl: bool
argument to select between ochl and ohlc ordering of quotes
Returns
-------
lines : list
list of tuples of the lines added (one tuple per quote)
"""
#
unfortunately this has a different return type than plot_day_summary2_*
lines =
[]
for
q
in
quotes:
if
ochl:
t, open, close, high, low
= q[:5
]
else
:
t, open, high, low, close
= q[:5
]
if
close >=
open:
color
=
colorup
else
:
color
=
colordown
vline
= Line2D(xdata=(t, t), ydata=
(low, high),
color
=
color,
antialiased
=False,
#
no need to antialias vert lines
)
oline
= Line2D(xdata=(t, t), ydata=
(open, open),
color
=
color,
antialiased
=
False,
marker
=
TICKLEFT,
markersize
=
ticksize,
)
cline
= Line2D(xdata=(t, t), ydata=
(close, close),
color
=
color,
antialiased
=
False,
markersize
=
ticksize,
marker
=
TICKRIGHT)
lines.extend((vline, oline, cline))
ax.add_line(vline)
ax.add_line(oline)
ax.add_line(cline)
ax.autoscale_view()
return
lines
def
candlestick_ochl(ax, quotes, width=0.2, colorup=
'
k
'
, colordown=
'
r
'
,
alpha
=1.0
):
"""
Plot the time, open, close, high, low as a vertical line ranging
from low to high. Use a rectangular bar to represent the
open-close span. If close >= open, use colorup to color the bar,
otherwise use colordown
Parameters
----------
ax : `Axes`
an Axes instance to plot to
quotes : sequence of (time, open, close, high, low, ...) sequences
As long as the first 5 elements are these values,
the record can be as long as you want (e.g., it may store volume).
time must be in float days format - see date2num
width : float
fraction of a day for the rectangle width
colorup : color
the color of the rectangle where close >= open
colordown : color
the color of the rectangle where close < open
alpha : float
the rectangle alpha level
Returns
-------
ret : tuple
returns (lines, patches) where lines is a list of lines
added and patches is a list of the rectangle patches added
"""
return
_candlestick(ax, quotes, width=width, colorup=
colorup,
colordown
=
colordown,
alpha
=alpha, ochl=
True)
def
plt_KLineChart(data,stockCode,step=20,fontSize=13,figsize=(12,6
)):
'''
:param data: type for DataFrame
:param stockCode: stock code
:param step: xticks step
:param fontSize: font size
:param figsize: window size
:return:
'''
prices
= data[[
'
open
'
,
'
high
'
,
'
low
'
,
'
close
'
]]
fig
= plt.figure(figsize=
figsize)
ax
= fig.add_axes([0.06, 0.15, 0.9, 0.75])
#
margin_left margin_bottom width height
candlestick_ohlc(ax, prices, width=0.5, colorup=
'
r
'
, colordown=
'
b
'
)
dataIndex
= [str(i).split(
'
'
)[0]
for
i
in
data.iloc[::step, :].index]
location
=
list(range(0,len(data.iloc[:,0]),step))
plt.xticks(location,dataIndex,rotation
=45
)
font_size
= {
'
size
'
: fontSize}
plt.ylabel(
'
prices
'
,font_size)
plt.title(
'
stock:%s
'
%
(stockCode),font_size)
plt.rcParams[
'
font.sans-serif
'
] = [
'
SimHei
'
]
#
设置字体为SimHei显示中文
plt.rcParams[
'
axes.unicode_minus
'
] = False
#
设置正常显示符号
def
candlestick_ohlc(ax, quotes, width=0.2, colorup=
'
k
'
, colordown=
'
r
'
,
alpha
=1.0
):
"""
Plot the time, open, high, low, close as a vertical line ranging
from low to high. Use a rectangular bar to represent the
open-close span. If close >= open, use colorup to color the bar,
otherwise use colordown
Parameters
----------
ax : `Axes`
an Axes instance to plot to
quotes : sequence of (time, open, high, low, close, ...) sequences
As long as the first 5 elements are these values,
the record can be as long as you want (e.g., it may store volume).
time must be in float days format - see date2num
width : float
fraction of a day for the rectangle width
colorup : color
the color of the rectangle where close >= open
colordown : color
the color of the rectangle where close < open
alpha : float
the rectangle alpha level
Returns
-------
ret : tuple
returns (lines, patches) where lines is a list of lines
added and patches is a list of the rectangle patches added
"""
return
_candlestick(ax, quotes, width=width, colorup=
colorup,
colordown
=
colordown,
alpha
=alpha, ochl=
False)
def
_candlestick(ax, quotes, width=0.2, colorup=
'
k
'
, colordown=
'
r
'
,
alpha
=1.0, ochl=
True):
"""
Plot the time, open, high, low, close as a vertical line ranging
from low to high. Use a rectangular bar to represent the
open-close span. If close >= open, use colorup to color the bar,
otherwise use colordown
Parameters
----------
ax : `Axes`
an Axes instance to plot to
quotes : sequence of quote sequences
data to plot. time must be in float date format - see date2num
(time, open, high, low, close, ...) vs
(time, open, close, high, low, ...)
set by `ochl`
width : float
fraction of a day for the rectangle width
colorup : color
the color of the rectangle where close >= open
colordown : color
the color of the rectangle where close < open
alpha : float
the rectangle alpha level
ochl: bool
argument to select between ochl and ohlc ordering of quotes
Returns
-------
ret : tuple
returns (lines, patches) where lines is a list of lines
added and patches is a list of the rectangle patches added
"""
OFFSET
= width / 2.0
lines
=
[]
patches
=
[]
quotes
=
np.column_stack([list(range(len(quotes))), quotes])
for
q
in
quotes:
if
ochl:
t, open, close, high, low
= q[:5
]
else
:
t, open, high, low, close
= q[:5
]
if
close >=
open:
color
=
colorup
lower
=
open
height
= close -
open
else
:
color
=
colordown
lower
=
close
height
= open -
close
vline
=
Line2D(
xdata
=(t, t), ydata=
(low, high),
color
=
color,
linewidth
=0.5
,
antialiased
=
True,
)
rect
=
Rectangle(
xy
=(t -
OFFSET, lower),
width
=
width,
height
=
height,
facecolor
=
color,
edgecolor
=
color,
)
rect.set_alpha(alpha)
lines.append(vline)
patches.append(rect)
ax.add_line(vline)
ax.add_patch(rect)
ax.autoscale_view()
return
lines, patches
def
_check_input(opens, closes, highs, lows, miss=-1
):
"""
Checks that *opens*, *highs*, *lows* and *closes* have the same length.
NOTE: this code assumes if any value open, high, low, close is
missing (*-1*) they all are missing
Parameters
----------
ax : `Axes`
an Axes instance to plot to
opens : sequence
sequence of opening values
highs : sequence
sequence of high values
lows : sequence
sequence of low values
closes : sequence
sequence of closing values
miss : int
identifier of the missing data
Raises
------
ValueError
if the input sequences don't have the same length
"""
def
_missing(sequence, miss=-1
):
"""
Returns the index in *sequence* of the missing data, identified by
*miss*
Parameters
----------
sequence :
sequence to evaluate
miss :
identifier of the missing data
Returns
-------
where_miss: numpy.ndarray
indices of the missing data
"""
return
np.where(np.array(sequence) ==
miss)[0]
same_length
= len(opens) == len(highs) == len(lows) ==
len(closes)
_missopens
=
_missing(opens)
same_missing
= ((_missopens == _missing(highs)).all()
and
(_missopens
== _missing(lows)).all()
and
(_missopens
==
_missing(closes)).all())
if
not
(same_length
and
same_missing):
msg
= (
"
*opens*, *highs*, *lows* and *closes* must have the same
"
"
length. NOTE: this code assumes if any value open, high,
"
"
low, close is missing (*-1*) they all must be missing.
"
)
raise
ValueError(msg)
def
plot_day_summary2_ochl(ax, opens, closes, highs, lows, ticksize=4
,
colorup
=
'
k
'
, colordown=
'
r
'
):
"""
Represent the time, open, close, high, low, as a vertical line
ranging from low to high. The left tick is the open and the right
tick is the close.
Parameters
----------
ax : `Axes`
an Axes instance to plot to
opens : sequence
sequence of opening values
closes : sequence
sequence of closing values
highs : sequence
sequence of high values
lows : sequence
sequence of low values
ticksize : int
size of open and close ticks in points
colorup : color
the color of the lines where close >= open
colordown : color
the color of the lines where close < open
Returns
-------
ret : list
a list of lines added to the axes
"""
return
plot_day_summary2_ohlc(ax, opens, highs, lows, closes, ticksize,
colorup, colordown)
def
plot_day_summary2_ohlc(ax, opens, highs, lows, closes, ticksize=4
,
colorup
=
'
k
'
, colordown=
'
r
'
):
"""
Represent the time, open, high, low, close as a vertical line
ranging from low to high. The left tick is the open and the right
tick is the close.
*opens*, *highs*, *lows* and *closes* must have the same length.
NOTE: this code assumes if any value open, high, low, close is
missing (*-1*) they all are missing
Parameters
----------
ax : `Axes`
an Axes instance to plot to
opens : sequence
sequence of opening values
highs : sequence
sequence of high values
lows : sequence
sequence of low values
closes : sequence
sequence of closing values
ticksize : int
size of open and close ticks in points
colorup : color
the color of the lines where close >= open
colordown : color
the color of the lines where close < open
Returns
-------
ret : list
a list of lines added to the axes
"""
_check_input(opens, highs, lows, closes)
rangeSegments
= [((i, low), (i, high))
for
i, low, high
in
zip(xrange(len(lows)), lows, highs)
if
low != -1
]
#
the ticks will be from ticksize to 0 in points at the origin and
#
we'll translate these to the i, close location
openSegments = [((-
ticksize, 0), (0, 0))]
#
the ticks will be from 0 to ticksize in points at the origin and
#
we'll translate these to the i, close location
closeSegments =
[((0, 0), (ticksize, 0))]
offsetsOpen
= [(i, open)
for
i, open
in
zip(xrange(len(opens)), opens)
if
open != -1
]
offsetsClose
= [(i, close)
for
i, close
in
zip(xrange(len(closes)), closes)
if
close != -1
]
scale
= ax.figure.dpi * (1.0 / 72.0
)
tickTransform
= Affine2D().scale(scale, 0.0
)
colorup
=
mcolors.to_rgba(colorup)
colordown
=
mcolors.to_rgba(colordown)
colord
=
{True: colorup, False: colordown}
colors
= [colord[open < close]
for
open, close
in
zip(opens, closes)
if
open != -1
and
close != -1
]
useAA
= 0,
#
use tuple here
lw = 1,
#
and here
rangeCollection =
LineCollection(rangeSegments,
colors
=
colors,
linewidths
=
lw,
antialiaseds
=
useAA,
)
openCollection
=
LineCollection(openSegments,
colors
=
colors,
antialiaseds
=
useAA,
linewidths
=
lw,
offsets
=
offsetsOpen,
transOffset
=
ax.transData,
)
openCollection.set_transform(tickTransform)
closeCollection
=
LineCollection(closeSegments,
colors
=
colors,
antialiaseds
=
useAA,
linewidths
=
lw,
offsets
=
offsetsClose,
transOffset
=
ax.transData,
)
closeCollection.set_transform(tickTransform)
minpy, maxx
=
(0, len(rangeSegments))
miny
= min([low
for
low
in
lows
if
low != -1
])
maxy
= max([high
for
high
in
highs
if
high != -1
])
corners
=
(minpy, miny), (maxx, maxy)
ax.update_datalim(corners)
ax.autoscale_view()
#
add these last
ax.add_collection(rangeCollection)
ax.add_collection(openCollection)
ax.add_collection(closeCollection)
return
rangeCollection, openCollection, closeCollection
def
candlestick2_ochl(ax, opens, closes, highs, lows, width=4
,
colorup
=
'
k
'
, colordown=
'
r
'
,
alpha
=0.75
):
"""
Represent the open, close as a bar line and high low range as a
vertical line.
Preserves the original argument order.
Parameters
----------
ax : `Axes`
an Axes instance to plot to
opens : sequence
sequence of opening values
closes : sequence
sequence of closing values
highs : sequence
sequence of high values
lows : sequence
sequence of low values
width : int
size of open and close ticks in points
colorup : color
the color of the lines where close >= open
colordown : color
the color of the lines where close < open
alpha : float
bar transparency
Returns
-------
ret : tuple
(lineCollection, barCollection)
"""
return
candlestick2_ohlc(ax, opens, highs, lows, closes, width=
width,
colorup
=colorup, colordown=
colordown,
alpha
=
alpha)
def
candlestick2_ohlc(ax, opens, highs, lows, closes, width=4
,
colorup
=
'
k
'
, colordown=
'
r
'
,
alpha
=0.75
):
"""
Represent the open, close as a bar line and high low range as a
vertical line.
NOTE: this code assumes if any value open, low, high, close is
missing they all are missing
Parameters
----------
ax : `Axes`
an Axes instance to plot to
opens : sequence
sequence of opening values
highs : sequence
sequence of high values
lows : sequence
sequence of low values
closes : sequence
sequence of closing values
width : int
size of open and close ticks in points
colorup : color
the color of the lines where close >= open
colordown : color
the color of the lines where close < open
alpha : float
bar transparency
Returns
-------
ret : tuple
(lineCollection, barCollection)
"""
_check_input(opens, highs, lows, closes)
delta
= width / 2
.
barVerts
= [((i -
delta, open),
(i
-
delta, close),
(i
+
delta, close),
(i
+
delta, open))
for
i, open, close
in
zip(xrange(len(opens)), opens, closes)
if
open != -1
and
close != -1
]
rangeSegments
=
[((i, low), (i, high))
for
i, low, high
in
zip(xrange(len(lows)), lows, highs)
if
low != -1
]
colorup
=
mcolors.to_rgba(colorup, alpha)
colordown
=
mcolors.to_rgba(colordown, alpha)
colord
=
{True: colorup, False: colordown}
colors
= [colord[open <
close]
for
open, close
in
zip(opens, closes)
if
open != -1
and
close != -1
]
useAA
= 0,
#
use tuple here
lw = 0.5,
#
and here
rangeCollection =
LineCollection(rangeSegments,
colors
=
colors,
linewidths
=
lw,
antialiaseds
=
useAA,
)
barCollection
=
PolyCollection(barVerts,
facecolors
=
colors,
edgecolors
=
colors,
antialiaseds
=
useAA,
linewidths
=
lw,
)
minx, maxx
=
0, len(rangeSegments)
miny
= min([low
for
low
in
lows
if
low != -1
])
maxy
= max([high
for
high
in
highs
if
high != -1
])
corners
=
(minx, miny), (maxx, maxy)
ax.update_datalim(corners)
ax.autoscale_view()
#
add these last
ax.add_collection(rangeCollection)
ax.add_collection(barCollection)
return
rangeCollection, barCollection
def
volume_overlay(ax, opens, closes, volumes,
colorup
=
'
k
'
, colordown=
'
r
'
,
width
=4, alpha=1.0
):
"""
Add a volume overlay to the current axes. The opens and closes
are used to determine the color of the bar. -1 is missing. If a
value is missing on one it must be missing on all
Parameters
----------
ax : `Axes`
an Axes instance to plot to
opens : sequence
a sequence of opens
closes : sequence
a sequence of closes
volumes : sequence
a sequence of volumes
width : int
the bar width in points
colorup : color
the color of the lines where close >= open
colordown : color
the color of the lines where close < open
alpha : float
bar transparency
Returns
-------
ret : `barCollection`
The `barrCollection` added to the axes
"""
colorup
=
mcolors.to_rgba(colorup, alpha)
colordown
=
mcolors.to_rgba(colordown, alpha)
colord
=
{True: colorup, False: colordown}
colors
= [colord[open <
close]
for
open, close
in
zip(opens, closes)
if
open != -1
and
close != -1
]
delta
= width / 2
.
bars
= [((i - delta, 0), (i - delta, v), (i + delta, v), (i +
delta, 0))
for
i, v
in
enumerate(volumes)
if
v != -1
]
barCollection
=
PolyCollection(bars,
facecolors
=
colors,
edgecolors
=((0, 0, 0, 1
),),
antialiaseds
=
(0,),
linewidths
=(0.5
,),
)
ax.add_collection(barCollection)
corners
=
(0, 0), (len(bars), max(volumes))
ax.update_datalim(corners)
ax.autoscale_view()
#
add these last
return
barCollection
def
volume_overlay2(ax, closes, volumes,
colorup
=
'
k
'
, colordown=
'
r
'
,
width
=4, alpha=1.0
):
"""
Add a volume overlay to the current axes. The closes are used to
determine the color of the bar. -1 is missing. If a value is
missing on one it must be missing on all
nb: first point is not displayed - it is used only for choosing the
right color
Parameters
----------
ax : `Axes`
an Axes instance to plot to
closes : sequence
a sequence of closes
volumes : sequence
a sequence of volumes
width : int
the bar width in points
colorup : color
the color of the lines where close >= open
colordown : color
the color of the lines where close < open
alpha : float
bar transparency
Returns
-------
ret : `barCollection`
The `barrCollection` added to the axes
"""
return
volume_overlay(ax, closes[:-1], closes[1:], volumes[1
:],
colorup, colordown, width, alpha)
def
volume_overlay3(ax, quotes,
colorup
=
'
k
'
, colordown=
'
r
'
,
width
=4, alpha=1.0
):
"""
Add a volume overlay to the current axes. quotes is a list of (d,
open, high, low, close, volume) and close-open is used to
determine the color of the bar
Parameters
----------
ax : `Axes`
an Axes instance to plot to
quotes : sequence of (time, open, high, low, close, ...) sequences
data to plot. time must be in float date format - see date2num
width : int
the bar width in points
colorup : color
the color of the lines where close1 >= close0
colordown : color
the color of the lines where close1 < close0
alpha : float
bar transparency
Returns
-------
ret : `barCollection`
The `barrCollection` added to the axes
"""
colorup
=
mcolors.to_rgba(colorup, alpha)
colordown
=
mcolors.to_rgba(colordown, alpha)
colord
=
{True: colorup, False: colordown}
dates, opens, highs, lows, closes, volumes
= list(zip(*
quotes))
colors
= [colord[close1 >=
close0]
for
close0, close1
in
zip(closes[:-1], closes[1
:])
if
close0 != -1
and
close1 != -1
]
colors.insert(0, colord[closes[0]
>=
opens[0]])
right
= width / 2.0
left
= -width / 2.0
bars
=
[((left, 0), (left, volume), (right, volume), (right, 0))
for
d, open, high, low, close, volume
in
quotes]
sx
= ax.figure.dpi * (1.0 / 72.0)
#
scale for points
sy = ax.bbox.height /
ax.viewLim.height
barTransform
=
Affine2D().scale(sx, sy)
dates
= [d
for
d, open, high, low, close, volume
in
quotes]
offsetsBars
= [(d, 0)
for
d
in
dates]
useAA
= 0,
#
use tuple here
lw = 0.5,
#
and here
barCollection =
PolyCollection(bars,
facecolors
=
colors,
edgecolors
=((0, 0, 0, 1
),),
antialiaseds
=
useAA,
linewidths
=
lw,
offsets
=
offsetsBars,
transOffset
=
ax.transData,
)
barCollection.set_transform(barTransform)
minpy, maxx
=
(min(dates), max(dates))
miny
=
0
maxy
= max([volume
for
d, open, high, low, close, volume
in
quotes])
corners
=
(minpy, miny), (maxx, maxy)
ax.update_datalim(corners)
#
print 'datalim', ax.dataLim.bounds
#
print 'viewlim', ax.viewLim.bounds
ax.add_collection(barCollection)
ax.autoscale_view()
return
barCollection
def
index_bar(ax, vals,
facecolor
=
'
b
'
, edgecolor=
'
l
'
,
width
=4, alpha=1.0
, ):
"""
Add a bar collection graph with height vals (-1 is missing).
Parameters
----------
ax : `Axes`
an Axes instance to plot to
vals : sequence
a sequence of values
facecolor : color
the color of the bar face
edgecolor : color
the color of the bar edges
width : int
the bar width in points
alpha : float
bar transparency
Returns
-------
ret : `barCollection`
The `barrCollection` added to the axes
"""
facecolors
=
(mcolors.to_rgba(facecolor, alpha),)
edgecolors
=
(mcolors.to_rgba(edgecolor, alpha),)
right
= width / 2.0
left
= -width / 2.0
bars
=
[((left, 0), (left, v), (right, v), (right, 0))
for
v
in
vals
if
v != -1
]
sx
= ax.figure.dpi * (1.0 / 72.0)
#
scale for points
sy = ax.bbox.height /
ax.viewLim.height
barTransform
=
Affine2D().scale(sx, sy)
offsetsBars
= [(i, 0)
for
i, v
in
enumerate(vals)
if
v != -1
]
barCollection
=
PolyCollection(bars,
facecolors
=
facecolors,
edgecolors
=
edgecolors,
antialiaseds
=
(0,),
linewidths
=(0.5
,),
offsets
=
offsetsBars,
transOffset
=
ax.transData,
)
barCollection.set_transform(barTransform)
minpy, maxx
=
(0, len(offsetsBars))
miny
=
0
maxy
= max([v
for
v
in
vals
if
v != -1
])
corners
=
(minpy, miny), (maxx, maxy)
ax.update_datalim(corners)
ax.autoscale_view()
#
add these last
ax.add_collection(barCollection)
return
barCollection
自动化学习。

 浙公网安备 33010602011771号