
Kibana:使用 Elasticsearch 和 Kibana 进行动态数据
现在你已经了解了基础知识,让我们尝试使用一些随机生成的 Elasticsearch 数据创建基于时间的折线图。 这与你在 Kibana 中创建新的 Vega 图时最初看到的内容相似,不同之处在于,我们将使用 Vega 语言而不是 Vega-Lite 的 Kibana 默认值(Vega的简化高级版本)。
创建随机的 Logstash 日志数据
如果你还不知道如何生成这些随机的数据,请参阅我之前的文章 “Logstash:运用 makelogs 创建测试日志”。我们使用如下的命令来生成20000个数据。我们首先为我们刚才生成的一个叫做 logstash-0 的索引创建一个 index pattern: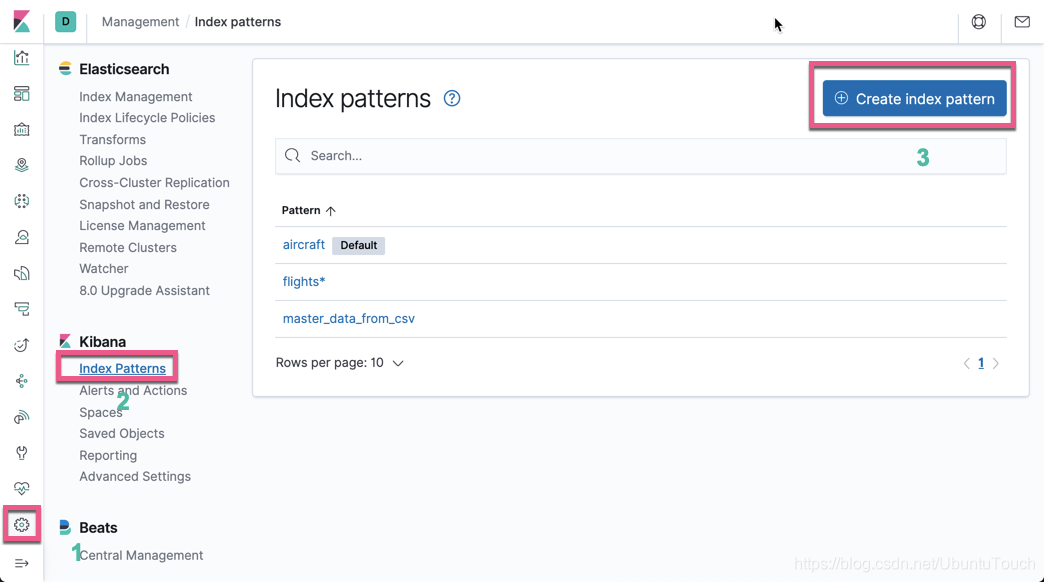

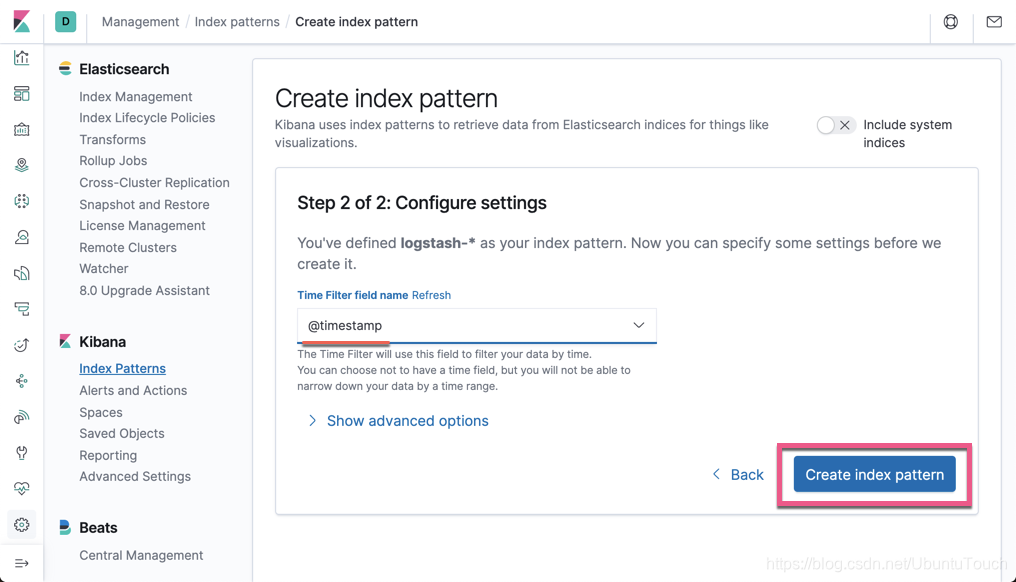
这样我们就生产了我们想要的 index pattern。
我们可以做一些简单的查询,比如:
GET logstash-0/_search
{
  "size": 5,
  "_source": ["@timestamp", "extension"]
}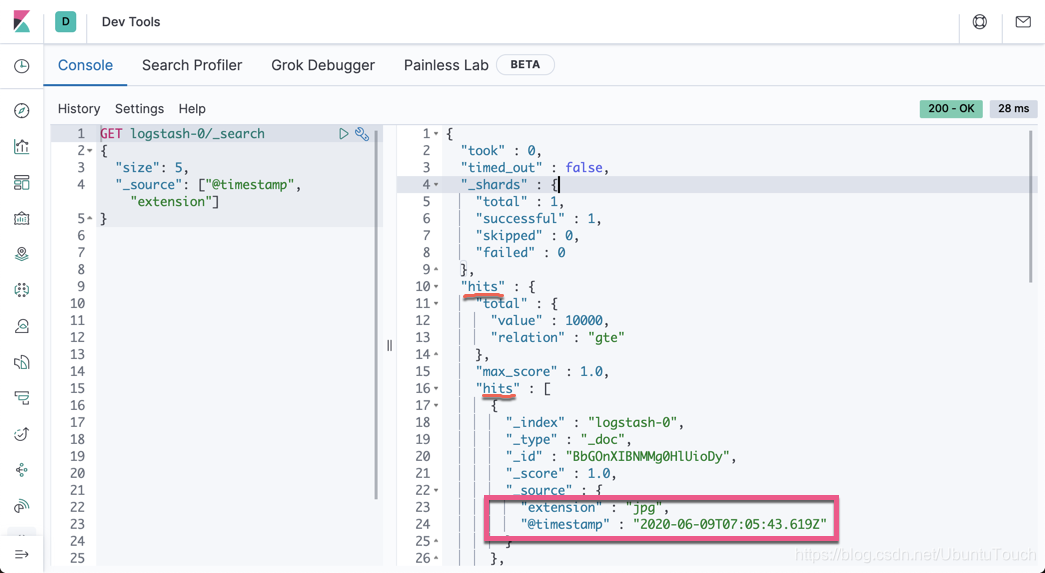
我们可以看到有一个timestamp 及文件的扩展名类型 extension。请注意上面的 hits.hits。这个也是我们在下面想要用到的。
运用 Vega 来展示数据
在上面的 Vega 实验中,我们对 values 数据进行硬编码,而不是使用 url 进行实际查询。 这样,我们可以继续在不支持 Kibana Elasticsearch 查询的 Vega 编辑器中进行测试。 如果你将值替换为url部分,则该图将在 Kibana 内部变得完全动态,如下所示。
{
"$schema": "https://vega/github.io/schema/vega-lite/v2.json",
data: {
"url": {
"index": "logstash-*",
"body": {
"size": 100,
"_source": ["@timestamp", "extension"]
}
}
"format":{"property":"hits.hits"}
},
"transform": [
{
"calculate": "toDate(datum._source['@timestamp'])", "as": "time"
},
{
"calculate": "datum._source.extension", "as": "ext"
}
],
"mark": "circle",
"encoding": {
}
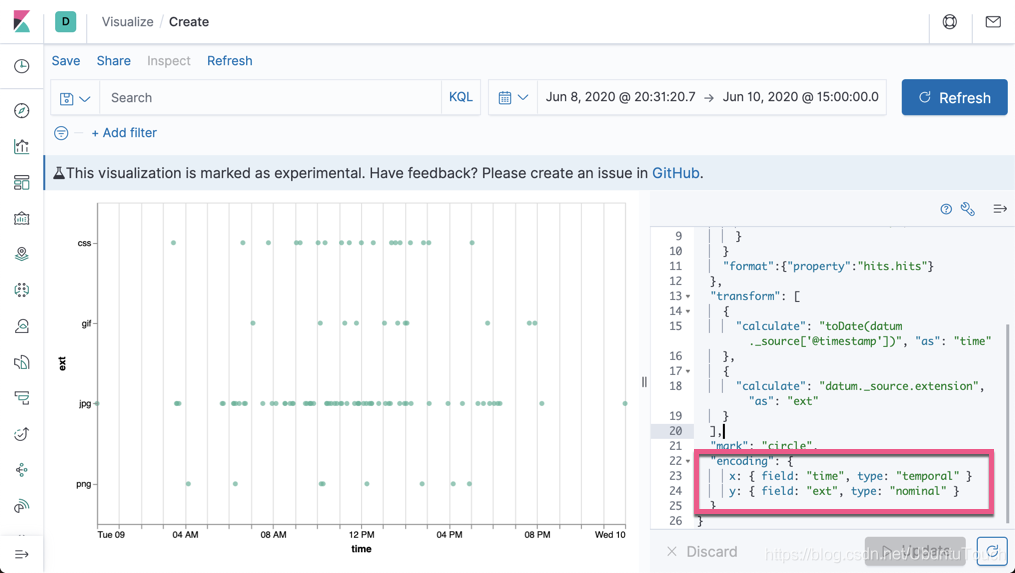
}在上面,我们替换之前 values 的硬编码,取而代之的是查询 logstash-* 索引。我们先查询 100 个数据,同时,我们只对 hits.hits 的内容感兴趣。另外我们通过 transform 把@timestamp 转换为 time,extension 转换为 ext。运行 Vega: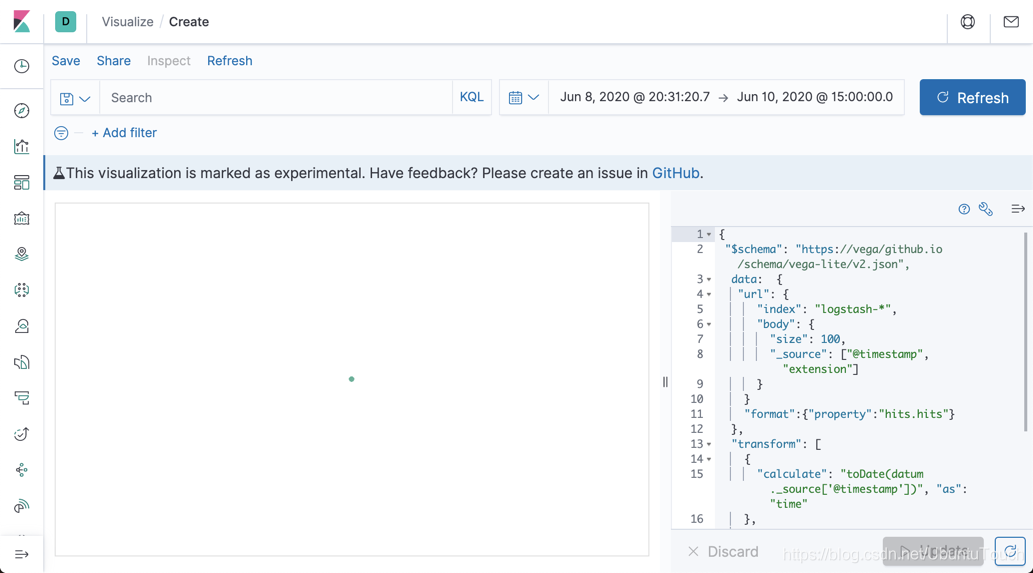
上面显示的是一个点,这是因为我们还没对 x 及 y 轴做任何的设置。
我们可以在浏览器中的 Developer Tools 里进行查看:

接下来我们配置 x 及 y 轴:
{
 "$schema": "https://vega/github.io/schema/vega-lite/v2.json",
  data:  {
   "url": {
      "index": "logstash-*",
      "body": {
        "size": 100,
        "_source": ["@timestamp", "extension"]
      }
    }
    "format":{"property":"hits.hits"}
  },
  "transform": [
    {
      "calculate": "toDate(datum._source['@timestamp'])", "as": "time"
    },
    {
      "calculate": "datum._source.extension", "as": "ext"
    }
  ],
  "mark": "circle",
  "encoding": {
     x: { field: "time", type: "temporal" }
     y: { field: "ext", type: "nominal" }
  }
}
就像我们上面的那样,我们可以添加颜色及形状:
{
 "$schema": "https://vega/github.io/schema/vega-lite/v2.json",
  data:  {
   "url": {
      "index": "logstash-*",
      "body": {
        "size": 100,
        "_source": ["@timestamp", "extension"]
      }
    }
    "format":{"property":"hits.hits"}
  },
  "transform": [
    {
      "calculate": "toDate(datum._source['@timestamp'])", "as": "time"
    },
    {
      "calculate": "datum._source.extension", "as": "ext"
    }
  ],
  "mark": "point",
  "encoding": {
     x: { field: "time", type: "temporal" }
     y: { field: "ext", type: "nominal" }
     color: {field: "ext", type: "nominal"}
     shape: {field: "ext", type: "nominal" }
  }
}
目前我们的数据还不能和 search field 相关联,比如我们搜索 extension:css,但是我们的显示的图还是不会变好。另外,当我们选择右上角的时间选择时,我们的也不会变化。为了能关联起来,我们添加如下的两个字段到 url 中:
      "%context%": true,
      "%timefield%": "@timestamp",
{
"$schema": "https://vega/github.io/schema/vega-lite/v2.json",
data: {
"url": {
"%context%": true,
"%timefield%": "@timestamp",
"index": "logstash-*",
"body": {
"size": 100,
"_source": ["@timestamp", "extension"]
}
}
"format":{"property":"hits.hits"}
},
"transform": [
{
"calculate": "toDate(datum._source['@timestamp'])", "as": "time"
},
{
"calculate": "datum._source.extension", "as": "ext"
}
],
"mark": "point",
"encoding": {
x: { field: "time", type: "temporal" }
y: { field: "ext", type: "nominal" }
color: {field: "ext", type: "nominal"}
shape: {field: "ext", type: "nominal" }
}
}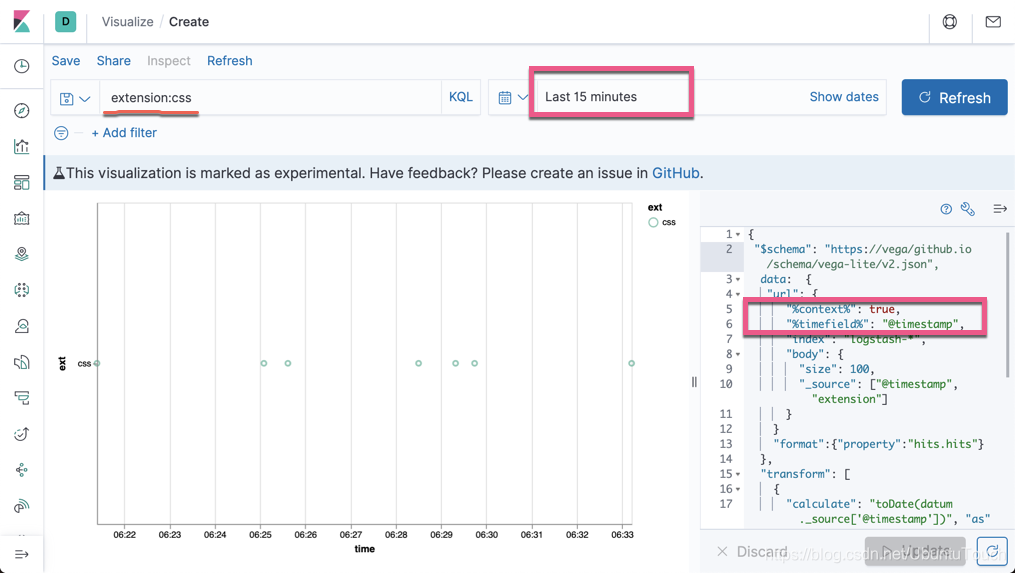
通过上面的关联,我们可以看出来,我们少了很多的数据,通过搜索 extension:css。
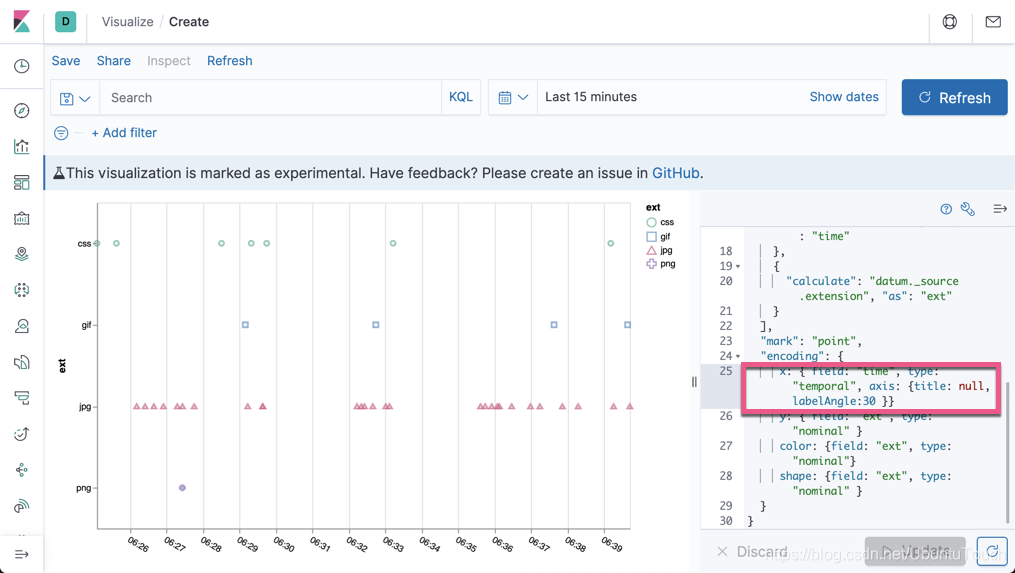
我们发现 x 轴的 time 是没有啥用处。我们可以去掉它。我们同时旋转时间的标签30度:
{
 "$schema": "https://vega/github.io/schema/vega-lite/v2.json",
  data:  {
   "url": {
      "%context%": true,
      "%timefield%": "@timestamp",
      "index": "logstash-*",
      "body": {
        "size": 100,
        "_source": ["@timestamp", "extension"]
      }
    }
    "format":{"property":"hits.hits"}
  },
  "transform": [
    {
      "calculate": "toDate(datum._source['@timestamp'])", "as": "time"
    },
    {
      "calculate": "datum._source.extension", "as": "ext"
    }
  ],
  "mark": "point",
  "encoding": {
     x: { field: "time", type: "temporal", axis: {title: null, labelAngle:30 }}
     y: { field: "ext", type: "nominal" }
     color: {field: "ext", type: "nominal"}
     shape: {field: "ext", type: "nominal" }
  }
}
接下来,我们尝试使用更多的数据,并使用 Elasticsearch 所提供的强大的 aggregation 功能。首先我们在 Kibana 中做如下的搜索:
GET logstash-0/_search
{
  "size": 0,
  "aggs": {
    "table": {
      "composite": {
        "size": 10000,
        "sources": [
          {
            "time": {
              "date_histogram": {
                "field": "@timestamp",
                "calendar_interval": "1d"
              }
            }
          },
          {
            "ext": {
              "terms": {
                "field": "extension.keyword"
              }
            }
          }
        ]
      }
    }
  }
}
它显示的结果为:
{
  "took" : 6,
  "timed_out" : false,
  "_shards" : {
    "total" : 1,
    "successful" : 1,
    "skipped" : 0,
    "failed" : 0
  },
  "hits" : {
    "total" : {
      "value" : 10000,
      "relation" : "gte"
    },
    "max_score" : null,
    "hits" : [ ]
  },
  "aggregations" : {
    "table" : {
      "after_key" : {
        "time" : 1591920000000,
        "ext" : "jpg"
      },
      "buckets" : [
        {
          "key" : {
            "time" : 1591574400000,
            "ext" : "css"
          },
          "doc_count" : 159
        },
        {
          "key" : {
            "time" : 1591574400000,
            "ext" : "gif"
          },
          "doc_count" : 71
        },
        {
          "key" : {
            "time" : 1591574400000,
            "ext" : "jpg"
          },
          "doc_count" : 592
        },
        {
          "key" : {
            "time" : 1591574400000,
            "ext" : "php"
          },
          "doc_count" : 25
        },
        {
          "key" : {
            "time" : 1591574400000,
            "ext" : "png"
          },
          "doc_count" : 80
        },
        {
          "key" : {
            "time" : 1591660800000,
            "ext" : "css"
          },
          "doc_count" : 1043
        },
        {
          "key" : {
            "time" : 1591660800000,
            "ext" : "gif"
          },
          "doc_count" : 458
        },
        {
          "key" : {
            "time" : 1591660800000,
            "ext" : "jpg"
          },
          "doc_count" : 4365
        },
        {
          "key" : {
            "time" : 1591660800000,
            "ext" : "php"
          },
          "doc_count" : 234
        },
        {
          "key" : {
            "time" : 1591660800000,
            "ext" : "png"
          },
          "doc_count" : 598
        },
        {
          "key" : {
            "time" : 1591747200000,
            "ext" : "css"
          },
          "doc_count" : 1048
        },
        {
          "key" : {
            "time" : 1591747200000,
            "ext" : "gif"
          },
          "doc_count" : 427
        },
        {
          "key" : {
            "time" : 1591747200000,
            "ext" : "jpg"
          },
          "doc_count" : 4301
        },
        {
          "key" : {
            "time" : 1591747200000,
            "ext" : "php"
          },
          "doc_count" : 199
        },
        {
          "key" : {
            "time" : 1591747200000,
            "ext" : "png"
          },
          "doc_count" : 639
        },
        {
          "key" : {
            "time" : 1591833600000,
            "ext" : "css"
          },
          "doc_count" : 936
        },
        {
          "key" : {
            "time" : 1591833600000,
            "ext" : "gif"
          },
          "doc_count" : 340
        },
        {
          "key" : {
            "time" : 1591833600000,
            "ext" : "jpg"
          },
          "doc_count" : 3715
        },
        {
          "key" : {
            "time" : 1591833600000,
            "ext" : "php"
          },
          "doc_count" : 192
        },
        {
          "key" : {
            "time" : 1591833600000,
            "ext" : "png"
          },
          "doc_count" : 579
        },
        {
          "key" : {
            "time" : 1591920000000,
            "ext" : "jpg"
          },
          "doc_count" : 6
        }
      ]
    }
  }
}
请注意上面的数据结构,在接下来的 Vega 中将被采用。
重新书写我们的 Vega:
{
 "$schema": "https://vega/github.io/schema/vega-lite/v2.json",
  data:  {
   "url": {
      "%context%": true,
      "%timefield%": "@timestamp",
      "index": "logstash-*",
      "body": {
        "size": 0,
        "aggs": {
          "table": {
            "composite": {
              "size": 10000,
              "sources": [
                {
                  "time": {
                    "date_histogram": {
                      "field": "@timestamp",
                      "interval": {%autointerval%:400}
                    }
                  }
                },
                {
                  "ext": {
                    "terms": {
                      "field": "extension.keyword"
                    }
                  }
                }
              ]
            }
          }
        }
      }
    }
    "format":{"property":"aggregations.table.buckets"}
  },
  "transform": [
    {
      "calculate": "toDate(datum.key.time)", "as": "time"
    },
    {
      "calculate": "datum.key.ext", "as": "ext"
    }
  ],
  "mark": "area",
  "encoding": {
     x: {
       field: "time",
       type: "temporal"
     },
     y: {
       axis: {title: "Document count"}
       field: "doc_count",
       type: "quantitative"
    }
    color: {field: "ext", type: "nominal"}
  }
}
请注意上面的有些地方已经根据 aggregation 的结果做了相应的调整。展示的结果是:
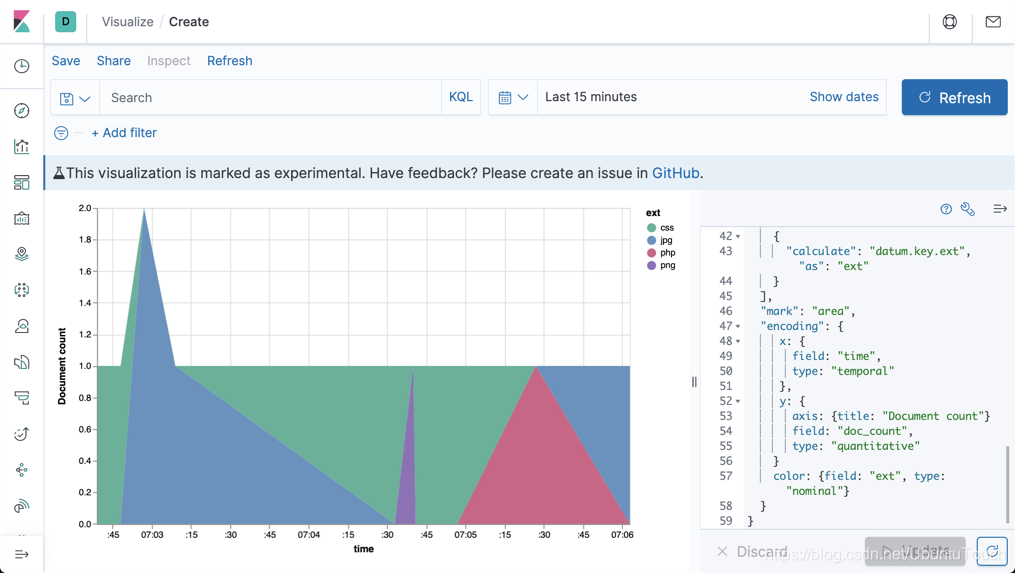
最后,我们取消 x 轴上的 time,并且,我们把所有的数据都 stack 起来:
{
 "$schema": "https://vega/github.io/schema/vega-lite/v2.json",
  data:  {
   "url": {
      "%context%": true,
      "%timefield%": "@timestamp",
      "index": "logstash-*",
      "body": {
        "size": 0,
        "aggs": {
          "table": {
            "composite": {
              "size": 10000,
              "sources": [
                {
                  "time": {
                    "date_histogram": {
                      "field": "@timestamp",
                      "interval": {%autointerval%:400}
                    }
                  }
                },
                {
                  "ext": {
                    "terms": {
                      "field": "extension.keyword"
                    }
                  }
                }
              ]
            }
          }
        }
      }
    }
    "format":{"property":"aggregations.table.buckets"}
  },
  "transform": [
    {
      "calculate": "toDate(datum.key.time)", "as": "time"
    },
    {
      "calculate": "datum.key.ext", "as": "ext"
    }
  ],
  "mark": "area",
  "encoding": {
     x: {
       field: "time",
       type: "temporal",
       axis: {title: null}
     },
     y: {
       axis: {title: "Document count"},
       field: "doc_count",
       type: "quantitative" ,
       stack: normalize
    }
    color: {field: "ext", type: "nominal"}
  }
}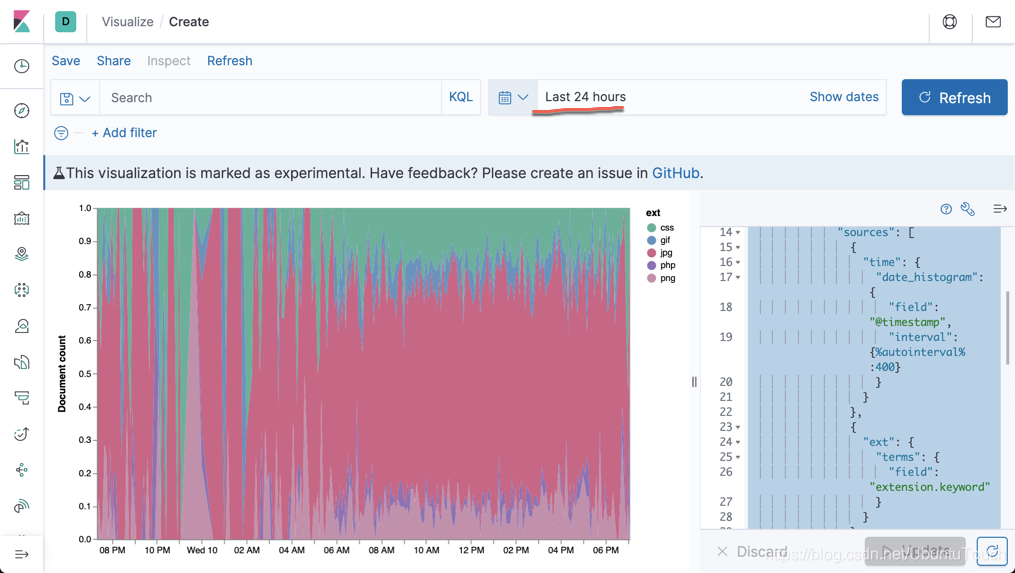
我们是使用 makelogs 生成的数据。它生成的数据是在一天内的,并且是平均的。从上面,我们可以看出来各个文件的比例。
好了。今天的文章就写到这里。希望大家也学到了一些东西。
更多资料:
【1】https://vega.github.io/vega-lite/tutorials/getting_started.html
【2】https://www.elastic.co/blog/getting-started-with-vega-visualizations-in-kibana
【3】 https://www.elastic.co/guide/en/kibana/master/vega-graph.html
【4】https://vega.github.io/vega/examples/
【5】https://vega.github.io/vega-lite/examples/

 浙公网安备 33010602011771号