pd.dataframe和series以及np.narray的维度升降
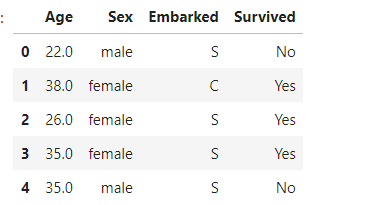
1.第一步读入泰坦尼克号数据集
import pandas as pd
data = pd.read_csv(r".\Narrativedata.csv"
,index_col=0
)#index_col=0将第0列作为索引,不写则认为第0列为特征

data.head()
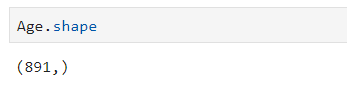
2.通过df的loc的函数从df中取出一列的数据,该数据格式为 : <class 'pandas.core.series.Series'>
age1=data.loc[:,"Age"]
print(type(age1))
age1.head()

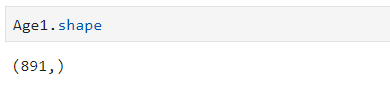
会发现数据维度:(891,)
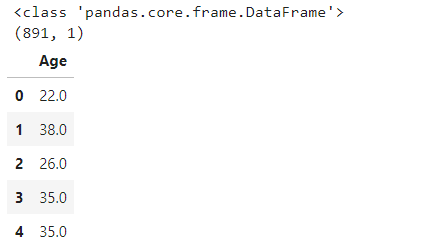
3.数据维度的转换 升维
因为sklearn里面的数据必须是二维
1.使用Series类的 to_dataframe
print(type(Age.to_frame()))
print(Age.to_frame().shape)
Age.to_frame().head()
2.使用reshape和values.reshape
age1=Age.reshape(-1,1)

age2=Age.values.reshape(-1,1)
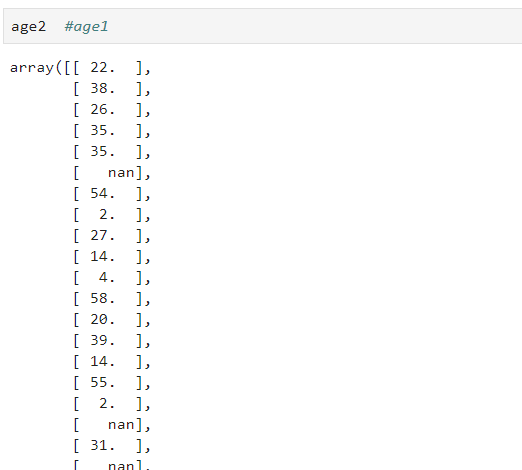
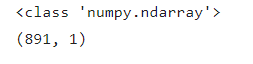
print(type(age2))
age2.shape
3.数据的降维
DataFrame 有个 apply 方法,就是把函数映射到 DataFrame 里面每个 Series 上,对 Series 进行操作。这是一种降维操作。
大多数人都以为是才智成就了科学家,他们错了,是品格。---爱因斯坦

 浙公网安备 33010602011771号