使用Filebeat 6 收集多个目录的日志并发送到lostash
1.安装filebeat 到目标机器
官方安装文档<-点这里
本测试使用windows环境安装filebeat
win:
1. Download the Filebeat Windows zip file from the downloads page.
2. Extract the contents of the zip file into C:\Program Files.
3. Rename the filebeat--windows directory to Filebeat.
4. Open a PowerShell prompt as an Administrator (right-click the PowerShell icon and select Run As Administrator). If you are running Windows XP, you may need to download and install PowerShell.
From the PowerShell prompt, run the following commands to install Filebeat as a Windows service:
PS > cd ‘C:\Program Files\Filebeat’
PS C:\Program Files\Filebeat> .\install-service-filebeat.ps1
2.配置filebeat
由于6.0之后的版本,不再支持 document_type 这个选项了
Starting with Logstash 6.0, the document_type option is deprecated due to the removal of types in Logstash 6.0. It will be removed in the next major version of Logstash. If you are running Logstash 6.0 or later, you do not need to set document_type in your configuration because Logstash sets the type to doc by default.
所以为了lostash能区分不同目录发过来的日志,我们使用 tags属性
tags
A list of tags that the Beat includes in the tags field of each published event. Tags make it easy to select specific events in Kibana or apply conditional filtering in Logstash. These tags will be appended to the list of tags specified in the general configuration.
修改filebeat的配置文件 filebeat.yml
修改为如下配置,开启2个prospectors,收集2个目录下的日志,同样支持这样的写法:/var/log/*/*.log
filebeat.prospectors:
- type: log
  # Change to true to enable this prospector configuration.
  enabled: true
  # Paths that should be crawled and fetched. Glob based paths.
  paths:
    - d:\IISlog\xxx.xxx.xxx\W3SVC12\*.log
  tags: ["iislog1"]
- type: log
  enabled: true
  paths:
    - d:\IISlog\xxx.xxx.xxx\W3SVC13\*.log
tags: ["iislog2"]- 同样添加输出到lostash的配置
output.logstash:
  # The Logstash hosts
hosts: ["xx.xx.xx.xx:5044"]- 3.修改前端lostash 的 shipper 配置文件
开启beat的收集端口,发送到redis
判断tags中,是否含有我们在filebeat配置中的根据目录设定的关键字,放入redis中
input{
        beats {
            port => 5044
        }
}
output{
    if "iislog1" in [tags]{    #写入iislog日志到redis
    redis  {
                host => "172.16.1.176"
                port => "6379"
                db => "3"
                data_type => "list"
                key => "iislog1"
        }
    }
    if "iislog2" in [tags]{    #写入iislog日志到redis
    redis  {
                host => "172.16.1.176"
                port => "6379"
                db => "3"
                data_type => "list"
                key => "iislog2"
        }
    }
}
4.修改后端 lostash 的 indexer 配置文件
input{
        redis  {
                host => "172.16.1.176"
                port => "6379"
                db => "3"
                data_type => "list"
                key => "iislog1"
                type => "iislog1"
        }
        redis  {
                host => "172.16.1.176"
                port => "6379"
                db => "3"
                data_type => "list"
                key => "iislog2"
                type => "iislog2"
        }
}
output{
    if [type] == "iislog1" {      #写入iislog日志到 es
         elasticsearch{
          hosts => ["172.16.1.176:9200"]
          index => "iislog1-%{+YYYY.MM.dd}"
        }
    }
    if [type] == "iislog2" {      #写入iislog日志到 es
         elasticsearch{
          hosts => ["172.16.1.176:9200"]
          index => "iislog2-%{+YYYY.MM.dd}"
        }
    }
}
5.测试效果
启动ELK ,进入kibana,然后手动写入一些日志,或者产生一些日志,可以看到 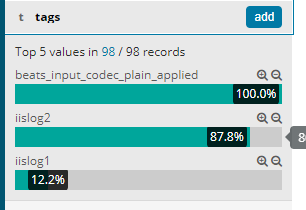
kibana中 看到tags区分了不同目录的日志,同样tags也可以在lostash 的filter plugin 中区分不同目录的日志做不同的操作

 浙公网安备 33010602011771号