

R语言实战 - 基本图形(5)- 箱线图
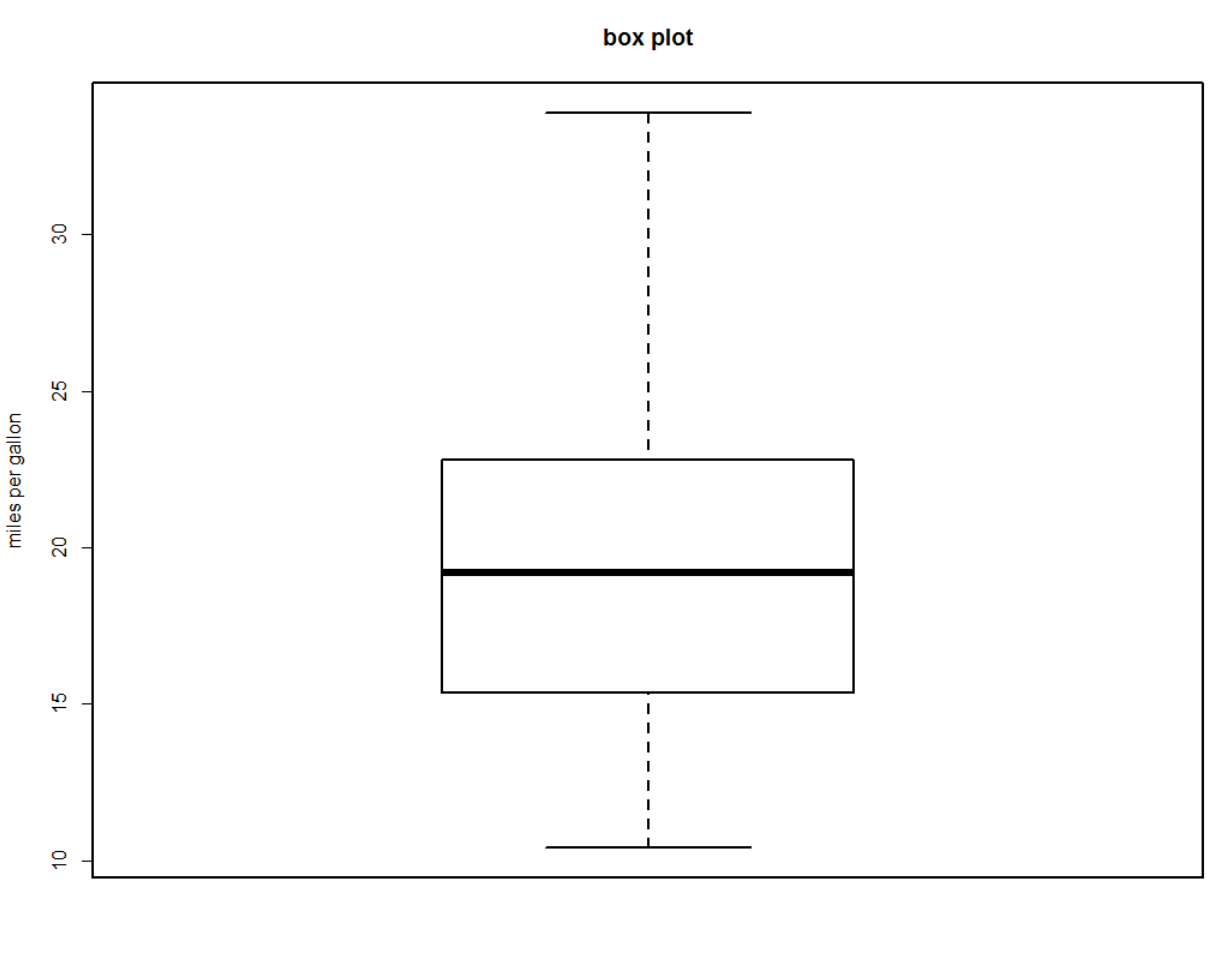
> boxplot(mtcars$mpg, main="box plot", ylab="miles per gallon")
> boxplot.stats(mtcars$mpg)
$stats
[1] 10.40 15.35 19.20 22.80 33.90

$n
[1] 32

$conf
[1] 17.11916 21.28084

$out
numeric(0)
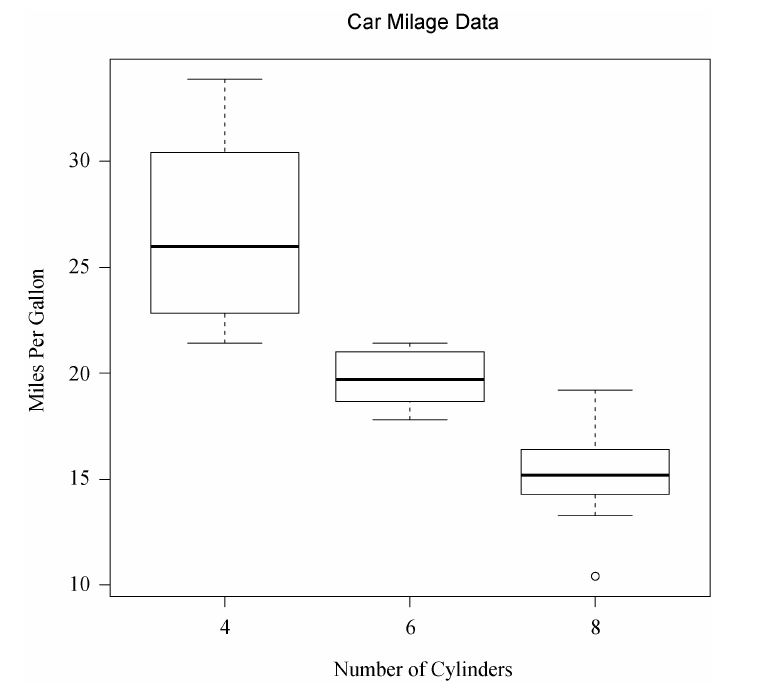
1. 使用并列箱型图进行跨组比较
> boxplot(mpg ~ cyl, data=mtcars,
+         main="cars mileage data",
+         xlab="number of cylinders",
+         ylab="miles per gallon")
>
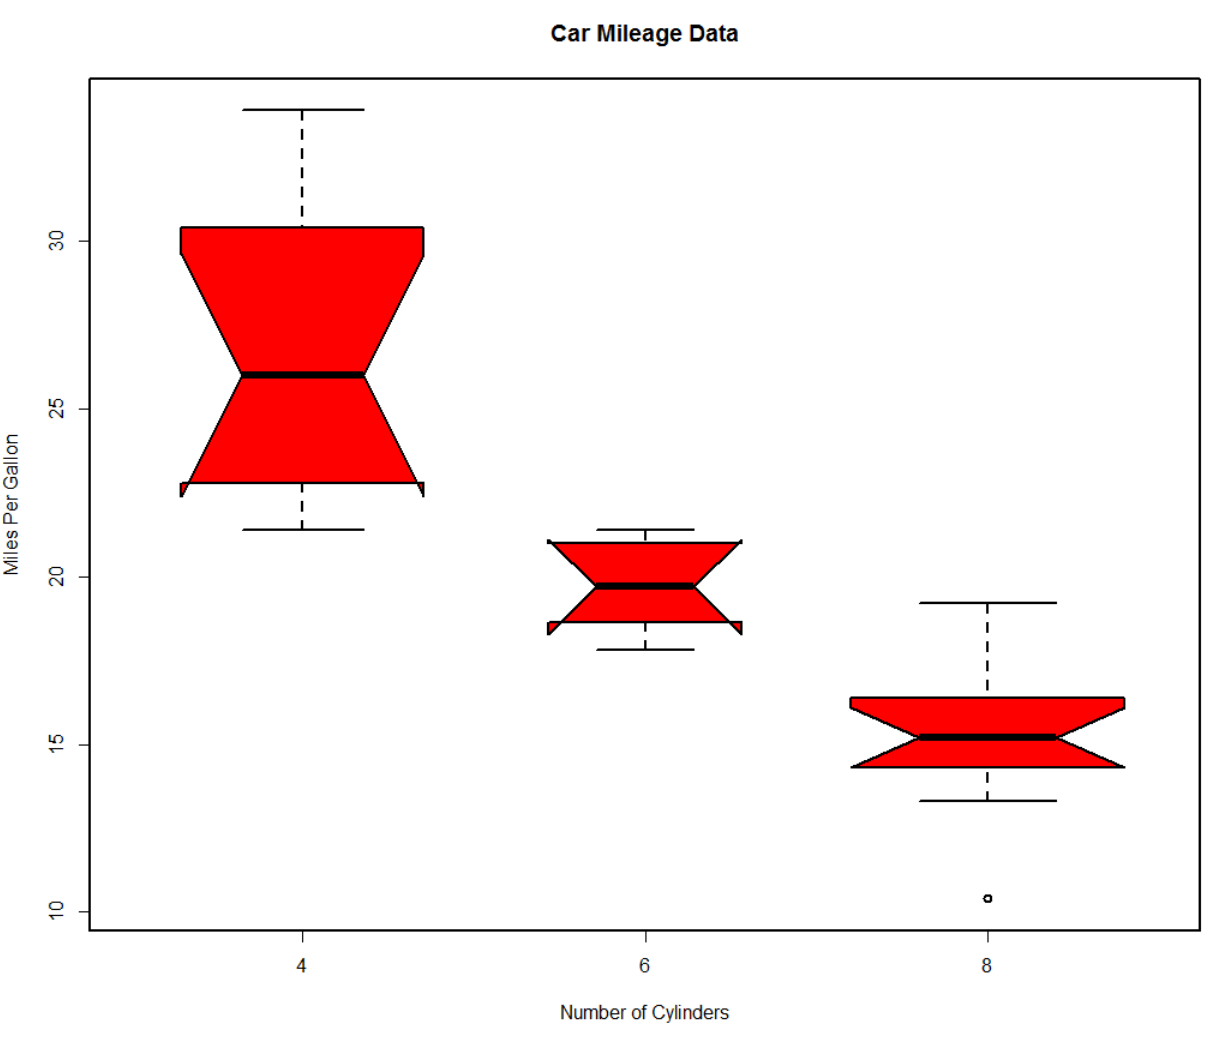
> boxplot(mpg ~ cyl, data=mtcars,
+         notch=TRUE,
+         varwidth=TRUE,
+         col="red",
+         main="Car Mileage Data",
+         xlab="Number of Cylinders",
+         ylab="Miles Per Gallon")
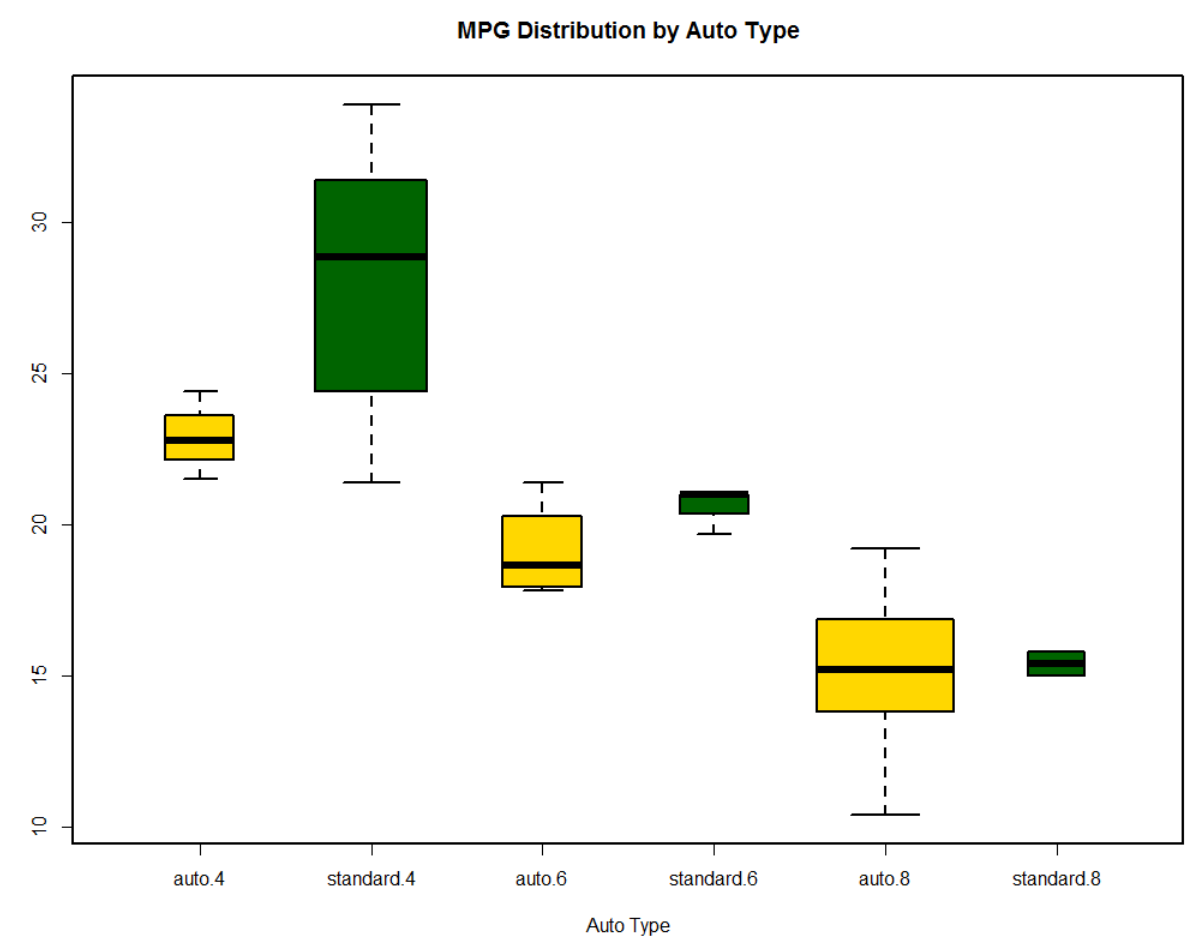
> mtcars$cyl.f <- factor(mtcars$cyl,
+                        levels=c(4,6,8),
+                        labels=c("4","6","8"))
> mtcars$am.f <- factor(mtcars$am,
+                       levels=c(0,1),
+                       labels=c("auto", "standard"))
> boxplot(mpg ~ am.f *cyl.f,
+         data=mtcars,
+         varwidth=TRUE,
+         col=c("gold", "darkgreen"),
+         main="MPG Distribution by Auto Type",
+         xlab="Auto Type")
>
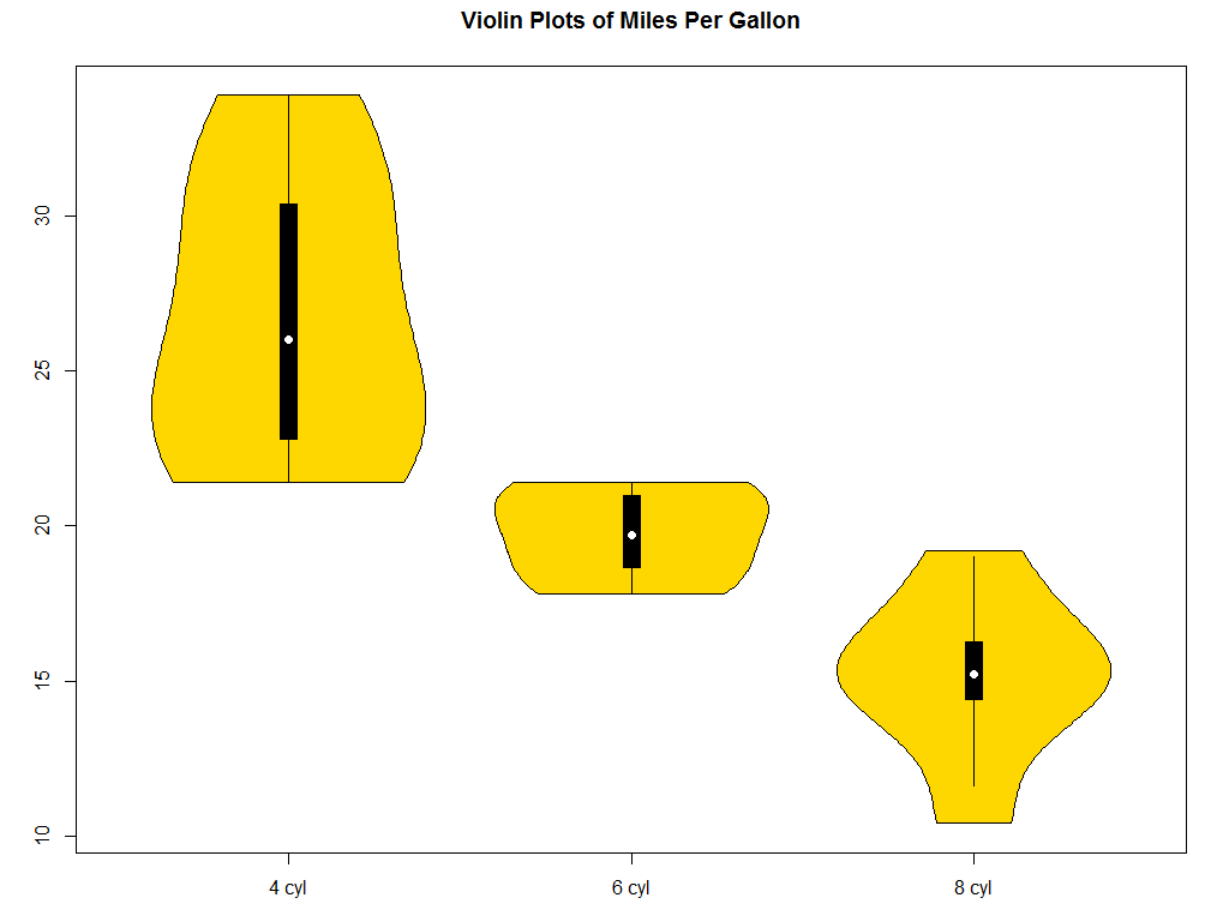
2. 小提琴图
> library(vioplot)
> x1 <- mtcars$mpg[mtcars$cyl==4]
> x2 <- mtcars$mpg[mtcars$cyl==6]
> x3 <- mtcars$mpg[mtcars$cyl==8]
> vioplot(x1, x2, x3,
+         names=c("4 cyl", "6 cyl", "8 cyl"),)
Error in vioplot(x1, x2, x3, names = c("4 cyl", "6 cyl", "8 cyl"), ) :
  argument is missing, with no default
> vioplot(x1, x2, x3,
+         names=c("4 cyl", "6 cyl", "8 cyl"),
+         col="gold")
> title("Violin Plots of Miles Per Gallon")
>
posted on 2017-09-24 23:43 你的踏板车要滑向哪里 阅读(694) 评论(0) 收藏 举报


 浙公网安备 33010602011771号