

Python高级数据处理与可视化(一)---- 聚类分析
1. 聚类分析
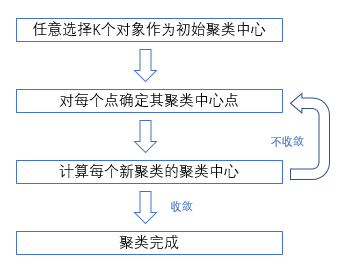
聚类分析(cluster analysis):以相似性为基础把相似的对象通过静态分类的方法分成不同的组别或更多的子集。特性:基于相似性,有多个聚类中心。
K-Means:「K-均值」算法表示以空间中K个点为中心进行聚类,对最靠近他们的对象归类。


In [47]: from numpy import vstack

In [48]: from scipy.cluster.vq import kmeans,vq

In [49]: list1 = [88.0,74.0,96.0,85.0]

In [50]: list2 = [92.0,99.0,95.0,94.0]

In [51]: list3 = [91.0,87.0,99.0,95.0]

In [52]: list4 = [78.0,99.0,97.0,81.0]

In [53]: list5 = [88.0,78.0,98.0,84.0]

In [54]: list6 = [100.0,95.0,100.0,92.0]

In [55]: data = vstack((list1,list2,list3,list4,list5,list6))  # Stack arrays in sequence vertically (row wise).Take a sequence of arrays and stack them vertically to make a single array.

In [61]: centroids,_ = kmeans(data,2)  # Performs k-means on a set of observation vectors forming k clusters.

In [62]: result,_ = vq(data,centroids)  # Assign codes from a code book to observations.

In [63]: result
Out[63]: array([1, 0, 0, 0, 1, 0])
numpy.vstack: https://docs.scipy.org/doc/numpy/reference/generated/numpy.vstack.html
scipy.cluster.vq.kmeans: https://docs.scipy.org/doc/scipy/reference/generated/scipy.cluster.vq.kmeans.html#scipy.cluster.vq.kmeans
scipy.cluster.vq.vq: https://docs.scipy.org/doc/scipy/reference/generated/scipy.cluster.vq.vq.html
In [88]: from numpy import vstack

In [89]: from scipy.cluster.vq import kmeans,vq

In [90]: from matplotlib.finance import quotes_historical_yahoo_ochl

In [91]: from datetime import datetime,date

In [92]: start = datetime(2016,1,1)

In [93]: end = datetime(2016,6,30)

In [94]: listDji = ['AXP','BA','CAT','CSCO','CVX','DD','DIS','GE','GS','HD','IBM','INTC','JNJ','JPM','KO','MCD','MMM','MRK','MSFT','NKE','PFE','PG','T','TRV','UNH','UTX','V','VZ','WMT','XOM']

In [105]: quote = [[0 for col in range(180)] for row in range(30)]

In [106]: listTemp = [[0 for col in range(180)] for row in range(30)]

In [107]: for i in range(30):
     ...:     quotes[i] = quotes_historical_yahoo_ochl(listDji[i],start,end)

In [108]: days = len(quotes[0])

In [116]: for i in range(30):
     ...:     for j in range(days-1):
     ...:         if (quotes[i][j][2] and quotes[i][j+1][2] and (quotes[i][j+1][2]>=quotes[i][j][2])):
     ...:             listTemp[i][j] = 1.0
     ...:         else:
     ...:             listTemp[i][j] = -1.0

In [117]: data = vstack(listTemp)

In [118]: centroids,_ = kmeans(data,4)

In [119]: result,_ = vq(data,centroids)

In [120]: result
Out[120]:
array([2, 0, 2, 2, 2, 3, 2, 2, 2, 2, 2, 2, 0, 2, 0, 0, 0, 1, 1, 2, 1, 0, 0,
       0, 1, 2, 2, 0, 0, 0])
查看聚类出的四类的结果:dfDji[(dfDji.result==1)]
2. Matplotlib绘图基础
3. Matplotlib图像属性控制
4. Pandas作图
5. 数据存取
6. Python的理工类应用
7. Python的人文社科类应用
posted on 2017-01-23 17:14 你的踏板车要滑向哪里 阅读(4373) 评论(0) 收藏 举报


 浙公网安备 33010602011771号