
caffe 学习(1) —— Classification: Instant Recognition with Caffe
学习地址http://nbviewer.jupyter.org/github/BVLC/caffe/blob/master/examples/00-classification.ipynb
1.安装matlabplotlib:
sudo apt-get install python-matplotlib
2. 安装google test, automake, google proto buffer
./autogen.sh: 43: autoreconf: not found
是因为没有安装automake
工具, 用下面的命令安装好就可以了。
- make[3]: *** [src/gtest.lo] Error 1
- make[3]: Leaving directory `/home/sisinc/Desktop/protobuf-2.4.1/gtest'
- make[2]: *** [check-local] Error 2
- make[2]: Leaving directory `/home/sisinc/Desktop/protobuf-2.4.1'
- make[1]: *** [check-am] Error 2
- make[1]: Leaving directory `/home/sisinc/Desktop/protobuf-2.4.1'
解决办法:安装最新版本gtest
安装gtest时稍微修改一下travis.sh文件,运行它即可。修改好的文件如下
#!/usr/bin/env sh
set -evx
env | sort

mkdir build || true
mkdir build/$GTEST_TARGET || true
cd build/$GTEST_TARGET
cmake -D gtest_build_samples=ON \
      -D gmock_build_samples=ON \
      -D gtest_build_tests=ON \
      -D gmock_build_tests=ON \
      -D CMAKE_CXX_FLAGS=$CXX_FLAGS \
      ../$GTEST_TARGET
make
make test
安装proto buffer:
sudo sh ./autogen.sh
make
sudo make check
sudo make install
默认是安装在“/usr/local/lib”下的,在有些平台/usr/local/lib不是默认的LD_LIBRARY_PATH变量里面,可以在通过如下命令改变安装目录
$ ./configure --prefix=/usr
当看到类似下面的文字,说明protobuf基本安装完成
============================================================================
Testsuite summary for Protocol Buffers 3.0.0-beta-2
============================================================================
# TOTAL: 6
# PASS: 6
# SKIP: 0
# XFAIL: 0
# FAIL: 0
# XPASS: 0
# ERROR: 0
============================================================================
安装protobuf的Python支持
cd python # 位于protobuf下
sudo python setup.py install
3. can not find module skimage.io错误,解决办法
安装skimage.io: sudo apt-get install python-sklearn python-skimage python-h5py
4.学习代码
# set up Python envirionment: numpy for numerical routines, and matplotlib for plotting
import numpy as np
import matplotlib.pyplot as plt
#display plots in this notebook
# %matplotlib inline
# set display defaults
plt.rcParams['figure.figsize'] = (10, 10) #large images
plt.rcParams['image.interpolation'] = 'nearest'
plt.rcParams['image.cmap'] = 'gray' #use grayscale output rather than a (potentiallly misleading) color heatmap
# load caffe
# the caffe module needs to be on the Python path
import sys
caffe_root='../'
sys.path.insert(0, caffe_root + 'python')
import caffe
import os
if os.path.isfile(caffe_root + 'models/bvlc_reference_caffenet/bvlc_reference_caffenet.caffemodel'):
print 'Caffenet found.'
else:
print 'Downloading pre-trained CaffeNet model...'
#../scripts/download_model_binary.py ../models/bvlc_reference_caffenet
caffe.set_mode_cpu()
model_def = caffe_root + 'models/bvlc_reference_caffenet/deploy.prototxt'
model_weights = caffe_root + 'models/bvlc_reference_caffenet/bvlc_reference_caffenet.caffemodel'
net = caffe.Net(model_def, # defines the structure of the model
model_weights, # contains the trained weights
caffe.TEST) # use test mode
# load the mean ImageNet Image (as distributed with caffe) for subtraction
mu = np.load(caffe_root + 'python/caffe/imagenet/ilsvrc_2012_mean.npy')
mu = mu.mean(1).mean(1) # average over pixels to obtain the mean (BGR) pixel values
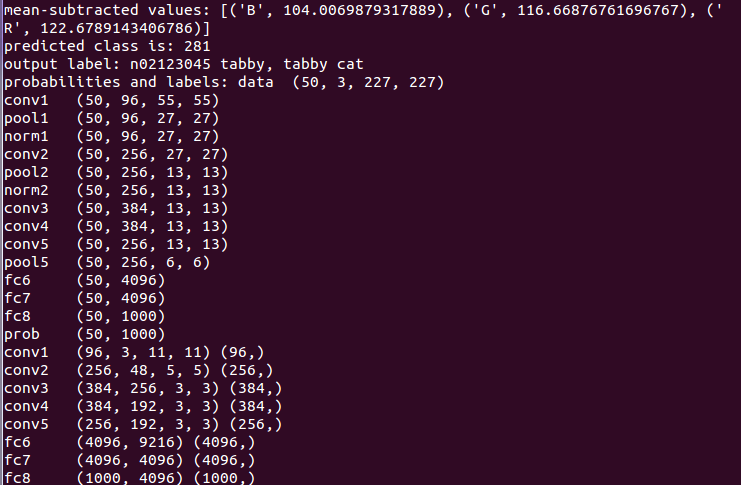
print 'mean-subtracted values:', zip('BGR', mu)
# create transformer for the imput called 'data'
transformer = caffe.io.Transformer({'data': net.blobs['data'].data.shape})
transformer.set_transpose('data', (2, 0, 1)) # move image channels to outermost dimension
transformer.set_mean('data', mu)
transformer.set_raw_scale('data', 255)
transformer.set_channel_swap('data', (2, 1, 0)) # swap channels from RGB to BGR
net.blobs['data'].reshape(50, # batch size
3, # 3-channel (BGR) images
227, 227) # image size is 227*227
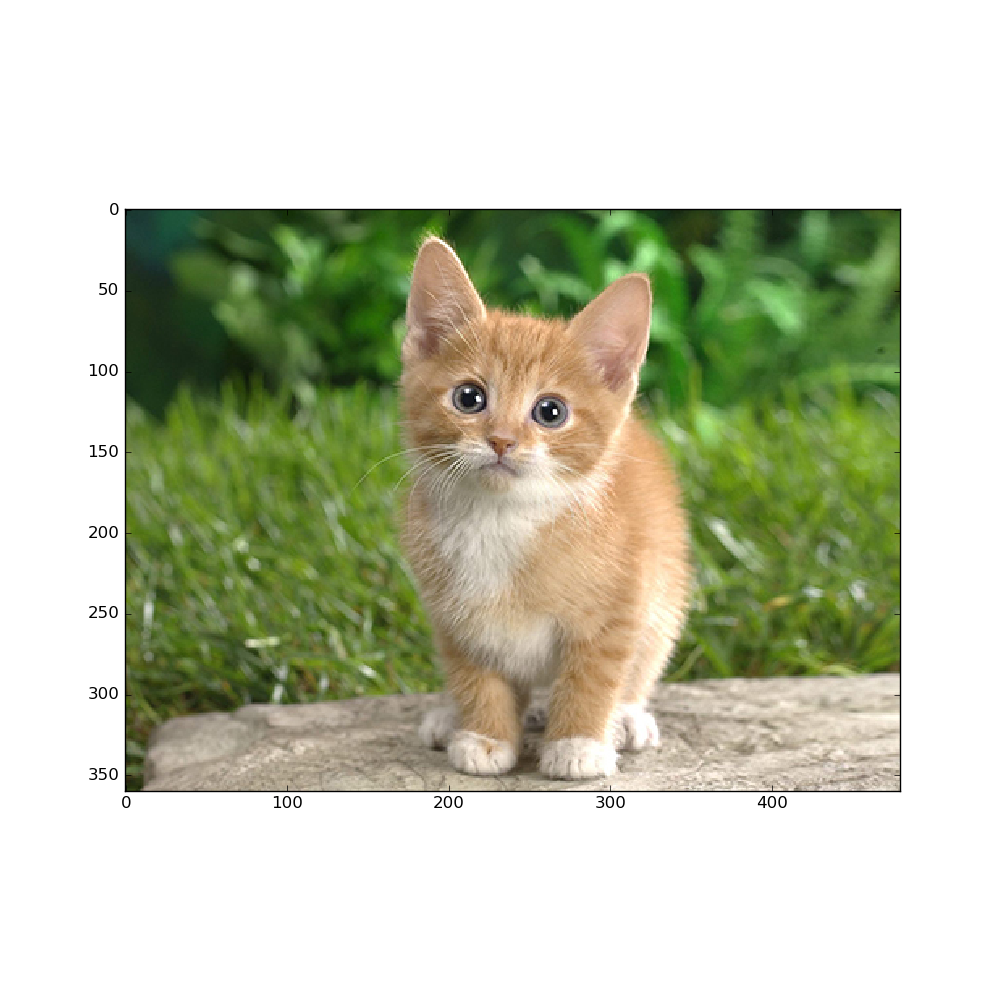
image = caffe.io.load_image(caffe_root + 'examples/images/cat.jpg')
transformed_image = transformer.preprocess('data', image)
plt.imshow(image)
plt.show()
# copy the image data into the memory allocated for the net
net.blobs['data'].data[...]=transformed_image
### perform calssification
output = net.forward()
output_prob = output['prob'][0] # the output probability vector for the first image in the batch
print 'predicted class is:', output_prob.argmax()
# load ImageNet labels
labels_file = caffe_root + 'data/ilsvrc12/synset_words.txt'
if not os.path.exists(labels_file):
#!../data/ilsvrc12/get_ilsvrc_aux.sh
print 'exetute the bash file above'
labels = np.loadtxt(labels_file, str, delimiter='\t')
print 'output label:', labels[output_prob.argmax()]
#sort top five predictions from softmax output
top_inds = output_prob.argsort()[::-1][:5] # reverse sort and take five largest items
print 'probabilities and labels:',
zip(output_prob[top_inds], labels[top_inds])
# %timeit net.forward()
# caffe.set_device(0)
caffe.set_mode_gpu()
net.forward()
# %timeit net.forward()
for layer_name, blob in net.blobs.iteritems():
print layer_name + '\t' + str(blob.data.shape)
for layer_name, param in net.params.iteritems():
print layer_name + '\t' + str(param[0].data.shape), str(param[1].data.shape)
def vis_square(data):
"""Take an array of shape (n, height, width) or (n, height, width, 3)
and visulaize each (height, widht) thing in a grid of size approx.sqrt(n) by sqrt(n)"""
# normalize data for display
data = (data - data.min())/(data.max() - data.min())
# force the number of filters to be square
n = int(np.ceil(np.sqrt(data.shape[0])))
padding = (((0, n**2 - data.shape[0]),
(0, 1), (0, 1)) # add some space between filters
+ ((0, 0),) * (data.ndim - 3)) #don't pad the last dimension (if there is one)
data = np.pad(data, padding, mode='constant', constant_values=1)
# tile the filters into an image
data = data.reshape((n, n) + data.shape[1:]).transpose((0, 2, 1, 3) + tuple(range(4, data.ndim + 1)))
data = data.reshape((n * data.shape[1], n * data.shape[3]) + data.shape[4:])
plt.imshow(data); plt.axis('off')
plt.show()
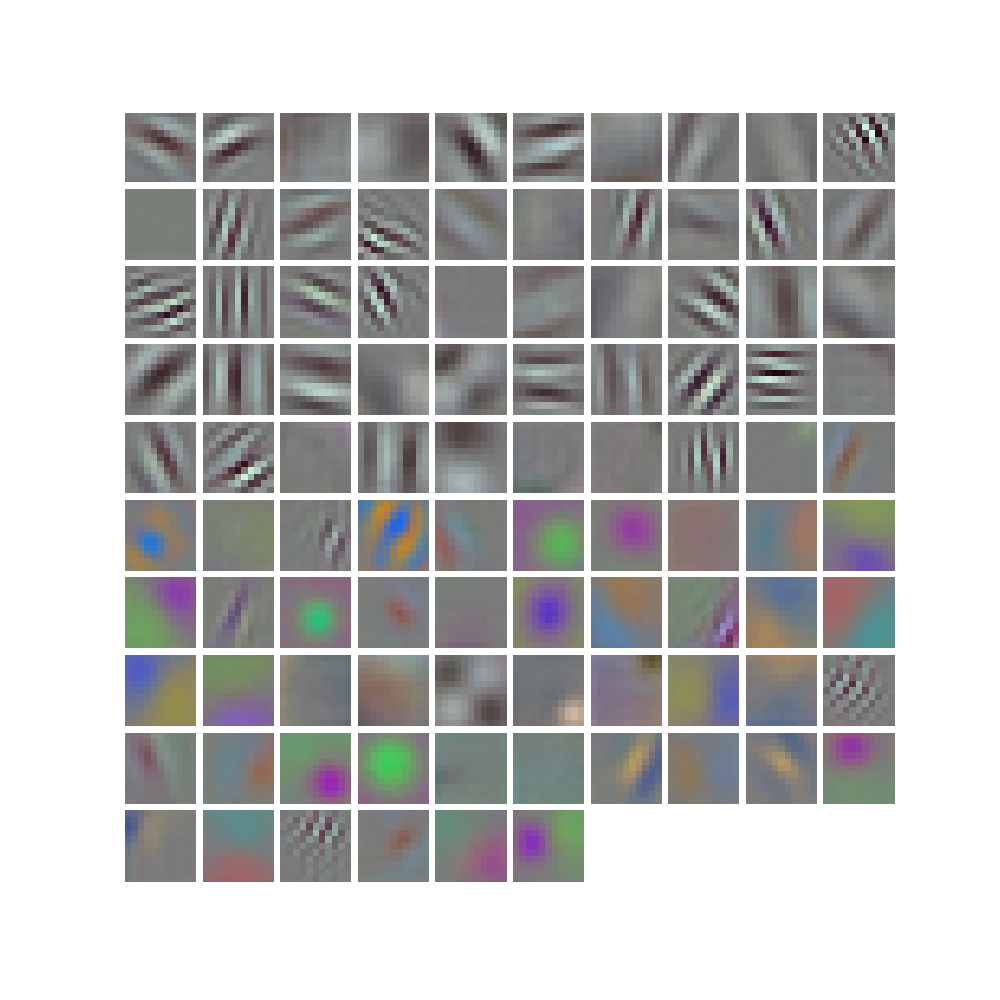
filters = net.params['conv1'][0].data
vis_square(filters.transpose(0, 2, 3, 1))
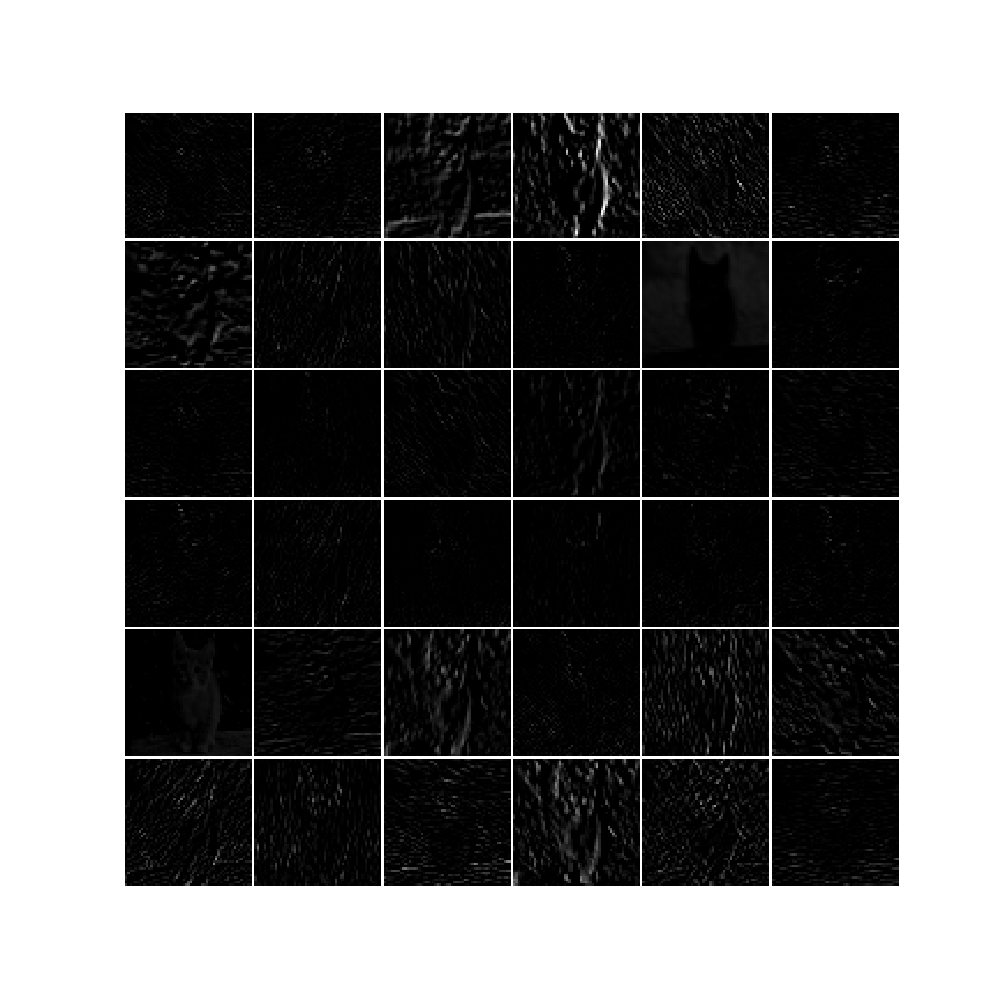
feat = net.blobs['conv1'].data[0, :36]
vis_square(feat)
feat = net.blobs['pool5'].data[0]
vis_square(feat)
feat = net.blobs['fc6'].data[0]
plt.subplot(2, 1, 1)
plt.plot(feat.flat)
plt.subplot(2, 1, 2)
_=plt.hist(feat.flat[feat.flat > 0], bins=100)
plt.show()
命令行下root用户运行python class_and_plot.py可以获得正确输出结果。


完成,继续努力!

 浙公网安备 33010602011771号