Python学习笔记(九)
Python学习笔记(九)—— Python计算生态
一、从数据处理到人工智能
1、流程
![]()


2、Python库的使用
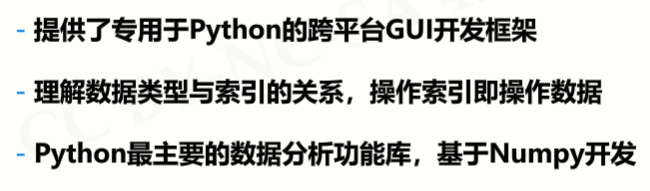
2.1 Python库之数据分析
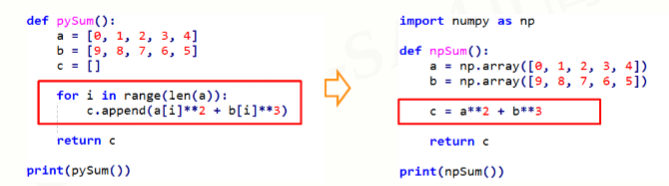
2.2.1 Numpy
![]()

例子:
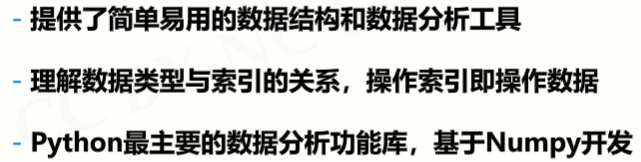
2.2.2 Pandas
![]()
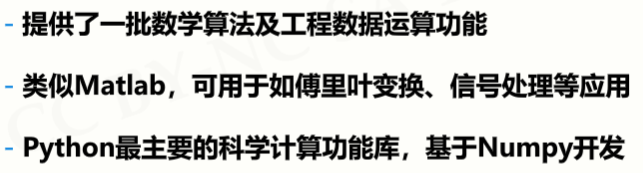
2.2.3 SciPy
![]()

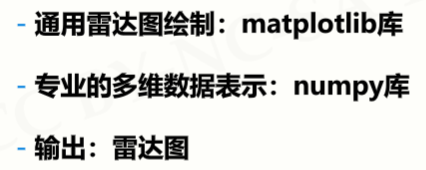
2.2 Python库之数据可视化
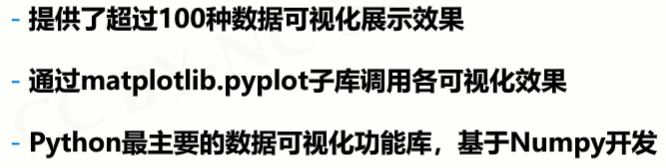
2.2.1 Matplotlib
![]()
2.2.2 Seaborn
![]()

2.2.3 Mayavi
![]()

2.3 Python库之文本处理
2.3.1 PyPDF2
![]()

2.3.2 NLTK
![]()

2.3.3 Python-docx
![]()

2.4 Python库之机器学习
2.4.1 Scikit-learn
![]()


2.4.2 TensorFlow
![]()

2.4.3 MXNet
![]()

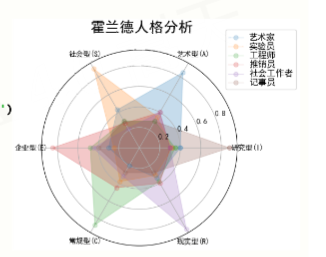
二、实例:霍兰德人格分析雷达图
1、问题分析


2、实例展示
#HollandRadarDraw
import numpy as np
import matplotlib.pyplot as plt
import matplotlib
matplotlib.rcParams['font.family']='SimHei'
radar_labels = np.array(['研究型(I)','艺术型(A)','社会型(S)',\
                         '企业型(E)','常规型(C)','现实型(R)']) #雷达标签
nAttr = 6
data = np.array([[0.40, 0.32, 0.35, 0.30, 0.30, 0.88],
                 [0.85, 0.35, 0.30, 0.40, 0.40, 0.30],
                 [0.43, 0.89, 0.30, 0.28, 0.22, 0.30],
                 [0.30, 0.25, 0.48, 0.85, 0.45, 0.40],
                 [0.20, 0.38, 0.87, 0.45, 0.32, 0.28],
                 [0.34, 0.31, 0.38, 0.40, 0.92, 0.28]]) #数据值
data_labels = ('艺术家', '实验员', '工程师', '推销员', '社会工作者','记事员')
angles = np.linspace(0, 2*np.pi, nAttr, endpoint=False)
data = np.concatenate((data, [data[0]]))
angles = np.concatenate((angles, [angles[0]]))
fig = plt.figure(facecolor="white")
plt.subplot(111, polar=True)
plt.plot(angles,data,'o-', linewidth=1, alpha=0.2)
plt.fill(angles,data, alpha=0.25)
plt.thetagrids(angles*180/np.pi, radar_labels,frac = 1.2)
plt.figtext(0.52, 0.95, '霍兰德人格分析', ha='center', size=20)
legend = plt.legend(data_labels, loc=(0.94, 0.80), labelspacing=0.1)
plt.setp(legend.get_texts(), fontsize='large')
plt.grid(True)
plt.savefig('holland_radar.jpg')
plt.show()
结果:
三、从Web解析到网络空间
1、Python库之网络爬虫
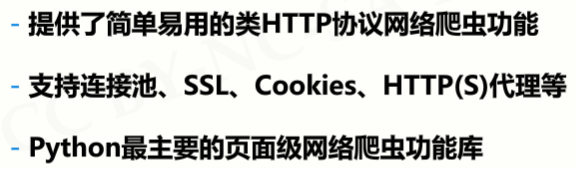
1.1 Requests
![]()
1.2 Scapy
![]()

1.3 pyspider
![]()

2、Python库之Web信息提取
2.1 Beautiful Soup
![]()

2.2 Re
![]()

2.3 Python-Goose
![]()

3、Python库之Web网站开发
3.1 Django
![]()

3.2 Pyramid
![]()

3.3 Flask
![]()

4、Python库之网络应用开发
4.1 WeRoBot
![]()

4.2 aip
![]()

4.3 MyQR
![]()

四、从人机交互到艺术设计
1、Python库之图形用户界面
1.1 PyQt5
![]()

1.2 wxPython
![]()
1.3 PyGObject
![]()

2、Python库之游戏开发
2.1 P有Game
![]()

2.2 Panda3D
![]()

2.3 cocos2d

3、Python库之虚拟现实
3.1 VR Zero

3.2 pyovr
3.3 Vizard

4、Python库之图形艺术
4.1 Quads

4.2 ascii_art

4.3 turtle
![]()
五、实例:玫瑰花绘制
1、问题分析


2、
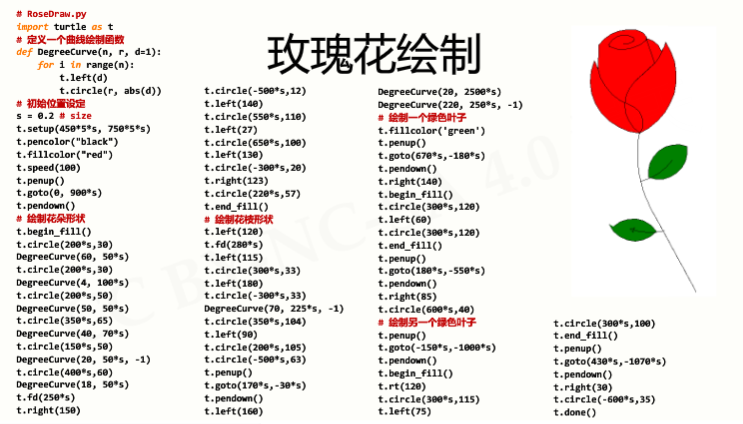
代码
#RoseDraw.py
import turtle as t
# 定义一个曲线绘制函数
def DegreeCurve(n, r, d=1):
    for i in range(n):
        t.left(d)
        t.circle(r, abs(d))
# 初始位置设定
s = 0.2 # size
t.setup(450*5*s, 750*5*s)
t.pencolor("black")
t.fillcolor("red")
t.speed(100)
t.penup()
t.goto(0, 900*s)
t.pendown()
# 绘制花朵形状
t.begin_fill()
t.circle(200*s,30)
DegreeCurve(60, 50*s)
t.circle(200*s,30)
DegreeCurve(4, 100*s)
t.circle(200*s,50)
DegreeCurve(50, 50*s)
t.circle(350*s,65)
DegreeCurve(40, 70*s)
t.circle(150*s,50)
DegreeCurve(20, 50*s, -1)
t.circle(400*s,60)
DegreeCurve(18, 50*s)
t.fd(250*s)
t.right(150)
t.circle(-500*s,12)
t.left(140)
t.circle(550*s,110)
t.left(27)
t.circle(650*s,100)
t.left(130)
t.circle(-300*s,20)
t.right(123)
t.circle(220*s,57)
t.end_fill()
# 绘制花枝形状
t.left(120)
t.fd(280*s)
t.left(115)
t.circle(300*s,33)
t.left(180)
t.circle(-300*s,33)
DegreeCurve(70, 225*s, -1)
t.circle(350*s,104)
t.left(90)
t.circle(200*s,105)
t.circle(-500*s,63)
t.penup()
t.goto(170*s,-30*s)
t.pendown()
t.left(160)
DegreeCurve(20, 2500*s)
DegreeCurve(220, 250*s, -1)
# 绘制一个绿色叶子
t.fillcolor('green')
t.penup()
t.goto(670*s,-180*s)
t.pendown()
t.right(140)
t.begin_fill()
t.circle(300*s,120)
t.left(60)
t.circle(300*s,120)
t.end_fill()
t.penup()
t.goto(180*s,-550*s)
t.pendown()
t.right(85)
t.circle(600*s,40)
# 绘制另一个绿色叶子
t.penup()
t.goto(-150*s,-1000*s)
t.pendown()
t.begin_fill()
t.rt(120)
t.circle(300*s,115)
t.left(75)
t.circle(300*s,100)
t.end_fill()
t.penup()
t.goto(430*s,-1070*s)
t.pendown()
t.right(30)
t.circle(-600*s,35)
t.done()

 浙公网安备 33010602011771号