# vue3 使用 echarts 展示某省份各区市数据
vue3 使用 echarts 展示某省份各区市数据
这个很简单,直接贴代码了
代码
echarts 使用的是最新版:"echarts": "^6.0.0"。
<template>
  <div class="ed-map-div">
    <div class="ed-map-model" ref="echartRef"></div>
  </div>
</template>
<script setup>
import { ref, onMounted } from 'vue'
import * as echarts from 'echarts'

const echartRef = ref(null)
const actBtn = ref(0)

let echartInstance = null;

let option = {
  backgroundColor: 'transparent',
  tooltip: {
    trigger: 'item',
    formatter: '{b}: {c}'
  },
  // 添加视觉映射组件,用于展示数据
  visualMap: {
    min: 0,
    max: 700,
    left: 'left',
    top: 'bottom',
    text: ['高', '低'],
    calculable: true,
    inRange: {
      color: ['#e0f3ff', '#0066cc']
    }
  },
  series: [{
    type: 'map',
    map: '辽宁',
    roam: true,
    label: {
      show: true,
      color: '#FFF',
      fontSize: 14,
      fontWeight: 'bold',
      fontFamily: '微软雅黑'
    },
    emphasis: {
      label: {
        show: true,
        fontSize: 14,
        color: '#FFF',
        fontWeight: 'bold'
      },
      itemStyle: {
        areaColor: '#ffcc00'
      }
    },
    data: [
      {
        value: 650,
        name: '沈阳市',
      },
      {
        value: 450,
        name: '大连市',
      },
      {
        value: 420,
        name: '鞍山市',
      },
      {
        value: 400,
        name: '抚顺市',
      },
      {
        value: 500,
        name: '本溪市',
      },
      {
        value: 600,
        name: '丹东市',
      },
      {
        value: 700,
        name: '铁岭市',
      },
      {
        value: 700,
        name: '阜新市',
      },
      {
        value: 700,
        name: '锦州市',
      },
      {
        value: 700,
        name: '朝阳市',
      },
      {
        value: 700,
        name: '盘锦市',
      },
      {
        value: 700,
        name: '葫芦岛市',
      },
      {
        value: 700,
        name: '营口市',
      },
      {
        value: 700,
        name: '辽阳市',
      },
    ]
  }]
}

onMounted(() => {
  echartInstance = echarts.init(echartRef.value)

  // 正确的地图数据加载方式
  import('../../json/210000.json').then(mapJson => {
    // 直接使用 JSON 数据注册地图
    echarts.registerMap('辽宁', mapJson)

    // 配置 ECharts 选项
    echartInstance.setOption(option)
  }).catch(error => {
    console.error('加载地图数据失败:', error)
  })

  // 添加窗口大小变化监听
  window.addEventListener('resize', () => {
    echartInstance.resize()
  })
})


</script>
<style scoped lang="scss">
.ed-map-div {
  width: 100%;
  height: 100%;
  position: relative;

  .ed-map-model {
    width: 100%;
    height: 100%;
  }
}
</style>
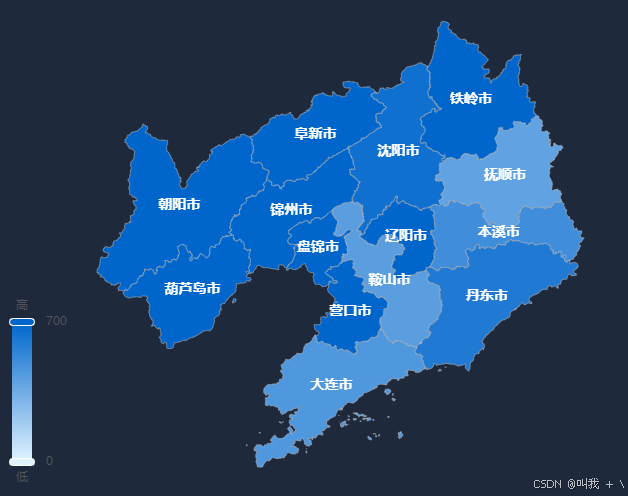
其中省份的 json 文件从这个网站可以下载:https://datav.aliyun.com/portal/school/atlas/area_selector#&lat=26.30662600587793&lng=118.28348353816342&zoom=7.5
最后完成的效果:
【版权声明】本博文著作权归作者所有,任何形式的转载都请联系作者获取授权并注明出处!
【重要说明】本博文为个人学习记录,观点仅为个人见解,不代表技术领域的最终结论。撰写目的主要在于自我总结与经验分享,欢迎批评指正,本人将虚心改进。内容仅供参考,非专业建议,请理性判断。
【博客园地址】叫我+V : http://www.cnblogs.com/wjw1014
【CSDN地址】叫我+V : https://wjw1014.blog.csdn.net/
【Gitee地址】叫我+V :https://gitee.com/wjw1014
【重要说明】本博文为个人学习记录,观点仅为个人见解,不代表技术领域的最终结论。撰写目的主要在于自我总结与经验分享,欢迎批评指正,本人将虚心改进。内容仅供参考,非专业建议,请理性判断。
【博客园地址】叫我+V : http://www.cnblogs.com/wjw1014
【CSDN地址】叫我+V : https://wjw1014.blog.csdn.net/
【Gitee地址】叫我+V :https://gitee.com/wjw1014

 浙公网安备 33010602011771号