<template>
<div ref="friendsTrend" class="mt-16 friendsTrend" />
</template>
<script>
import * as echarts from 'echarts'
import moment from 'moment'
import { getLineChartStatisticsData } from '../api/wxworkFriends'
export default {
name: 'FriendsLine',
props: {
date: {
type: Array,
default: () => []
},
userIdList: {
type: Array,
default: () => []
}
},
data() {
return {
myChart: null
}
},
mounted() {
this.getData()
window.addEventListener('resize', this.resize)
},
beforeDestroy() {
window.removeEventListener('resize', this.resize)
this.myChart && this.myChart.dispose()
this.myChart = null
},
methods: {
// 缩放处理
resize() {
this.myChart && this.myChart.resize()
},
getData() {
getLineChartStatisticsData({
userIdList: this.userIdList.map((item) => item.id),
startTime: `${ moment(this.date[0]).format('YYYY-MM-DD') } 00:00:00`,
endTime: `${ moment(this.date[1]).format('YYYY-MM-DD') } 23:59:59`
}).then((res) => {
if (res.data) {
this.appendData(res.data)
}
})
},
// 处理数据格式及渲染前处理,通过接口获取到数据后需要调用这个方法
appendData(data) {
// 这里需要处理横纵轴的数据展示,然后放到option里面
const currentTotalNumberList = data.map((item) => item.currentTotalNumber)
const todayIncreaseNumberList = data.map((item) => item.todayIncreaseNumber)
const todayAddNumberList = data.map((item) => item.todayAddNumber)
const todayDeleteNumberList = data.map((item) => item.todayDeleteNumber)
const todayLossNumberList = data.map((item) => item.todayLossNumber)
const xAxisList = data.map((item) => item.showTime)
const option = {
color: ['#165DFF', '#1FA087', '#D059D3', '#FF8B74', '#259DFF'],
tooltip: {
trigger: 'axis',
axisPointer: {
lineStyle: {
color: '#86909C', // 显示竖线颜色
type: 'dashed'
}
},
backgroundColor: 'rgba(0,0,0,0)', // tooltip背景色
borderColor: 'rgba(204,204,204,0)', // tooltip边框颜色
borderWidth: 1,
borderRadius: 4,
width: 300,
/* eslint-disable */
formatter: function (param) {
// 自定义tooltip内容
let text = ''
text += `<div style="background: rgba(204,204,204,0.1);border-radius:4px;padding:8px;backdrop-filter: blur(5px);box-shadow: 0px 0px 16px 0px rgba(29,48,92,0.15);">
<div style="color:#1D2129;font-size:12px;">${param[0].name}</div>`
param.forEach((item, index) => {
text += `<div style="background:#ffffff;border-radius:2px;margin:8px 0;padding:4px 8px;margint-bottom:30px">
<b style="display:inline-block;width:8px;height:8px;border-radius:6px;background-color:${param[index]?.color}"></b>
<span style="color:#4E5969;font-size: 12px; margin-right:50px;">${param[index]?.seriesName} </span>
<span style="float:right;color:#1D2129;font-size:12px;">${param[index]?.value}</span>
</div>`
})
text += `</div>`
return text
}
},
legend: {
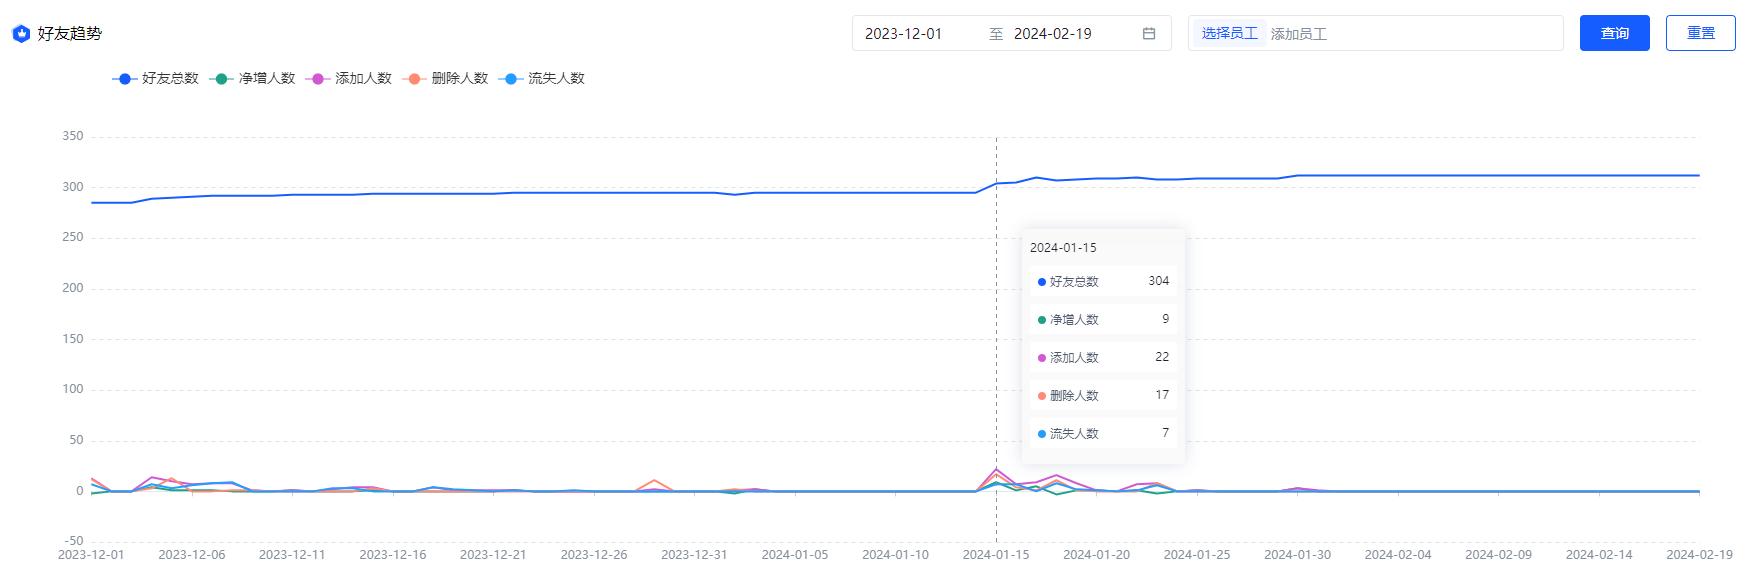
data: ['好友总数', '净增人数', '添加人数', '删除人数', '流失人数'],
top: '0%',
left: '97',
textStyle: {
fontSize: 14
}
},
grid: {
left: '3%',
right: '3%',
bottom: '1%',
top: '14%',
containLabel: true
},
xAxis: {
type: 'category',
boundaryGap: false,
data: xAxisList,
axisLine: {
// x轴
lineStyle: {
color: '#E5E6EB'
}
},
axisTick: {
// x轴刻度线
lineStyle: {
color: '#C9CDD4'
}
},
axisLabel: {
textStyle: {
color: '#86909C'
}
// interval: function (index, value) {
// if (xAxisList.length <= 12) {
// return true
// }
// // 取余后的个数
// const count = (xAxisList.length - 1) % 11
// if (index === xAxisList.length - 1 || index === 0) {
// return true
// } else {
// return (index % Math.floor((xAxisList.length - 1 - count) / 11) === 0) && (index < (xAxisList.length - count))
// }
// },
// formatter: function (value, index) {
// // 取余后的个数
// const count = (xAxisList.length - 1) % 11
// if (xAxisList.length <= 12) {
// return value
// }
// if (index === xAxisList.length - 1 || index === 0) {
// return value // 最后一个日期必须有文字展示
// } else if ((index % Math.floor((xAxisList.length - 1 - count) / 11) === 0) && (index < (xAxisList.length - count))) {
// return value // 其余的日期平均分配11个点
// } else {
// return ' '
// }
// }
}
},
yAxis: {
type: 'value',
minInterval: 1,
nameLocation: 'end',
nameTextStyle: {
color: '#86909C',
fontSize: 12,
marginRight: 23
// align:"left"
},
axisLine: {
// y轴线
show: false
},
axisTick: {
// y轴刻度
show: false
},
axisLabel: {
// show :false,
color: '#86909C'
},
splitLine: {
lineStyle: {
color: '#E4E4E4',
type: 'dashed'
}
}
},
series: [
{
name: '好友总数',
type: 'line',
data: currentTotalNumberList,
symbol: 'none'
},
{
name: '净增人数',
type: 'line',
data: todayIncreaseNumberList,
symbol: 'none'
},
{
name: '添加人数',
type: 'line',
data: todayAddNumberList,
symbol: 'none'
},
{
name: '删除人数',
type: 'line',
data: todayDeleteNumberList,
symbol: 'none'
},
{
name: '流失人数',
type: 'line',
data: todayLossNumberList,
symbol: 'none'
}
]
}
this.drawInit(option)
},
drawInit(option) {
this.$nextTick(() => {
const dom = this.$refs.friendsTrend
if (dom) {
this.myChart = echarts.init(dom)
this.myChart.clear() // 必写,清空数据,重新赋值
this.myChart.resize()
this.myChart.setOption(option)
}
})
}
}
}
</script>
<style lang="scss" scoped>
.friendsTrend {
height: 500px;
}
</style>

 浙公网安备 33010602011771号