使用Zabbix官方模板监控Redis运行状况
1、下载源码。
# git clone https://github.com/adubkov/zbx_redis_template.git
# cd zbx_redis_template
2、复制配置文件和脚本到相应目录。
# cp -a zbx_redis.conf /etc/zabbix/zabbix_agentd.d/
# mkdir -pv /etc/zabbix/monitor_scripts
# cp -a zbx_redis_stats.py /etc/zabbix/monitor_scripts/
3、修改py脚本中zabbix-server的IP。
# vim /etc/zabbix/monitor_scripts/zbx_redis_stats.py
zabbix_host = '172.17.213.222'   # Zabbix Server IP
zabbix_port = 10051              # Zabbix Server Port
4、修改配置文件中的脚本路径,并重启agent。
# vim /etc/zabbix/zabbix_agentd.d/zbx_redis.conf
  UserParameter=redis[*],/etc/zabbix/monitor_scripts/zbx_redis_stats.py -p 6379 -a password $1 $2 $3
# systemctl restart redis
5、安装redis模块。
# pip install redis
6、测试脚本是否可用。
# /etc/zabbix/monitor_scripts/zbx_redis_stats.py -p 6379 -a password localhost gcc_version none
4.4.7
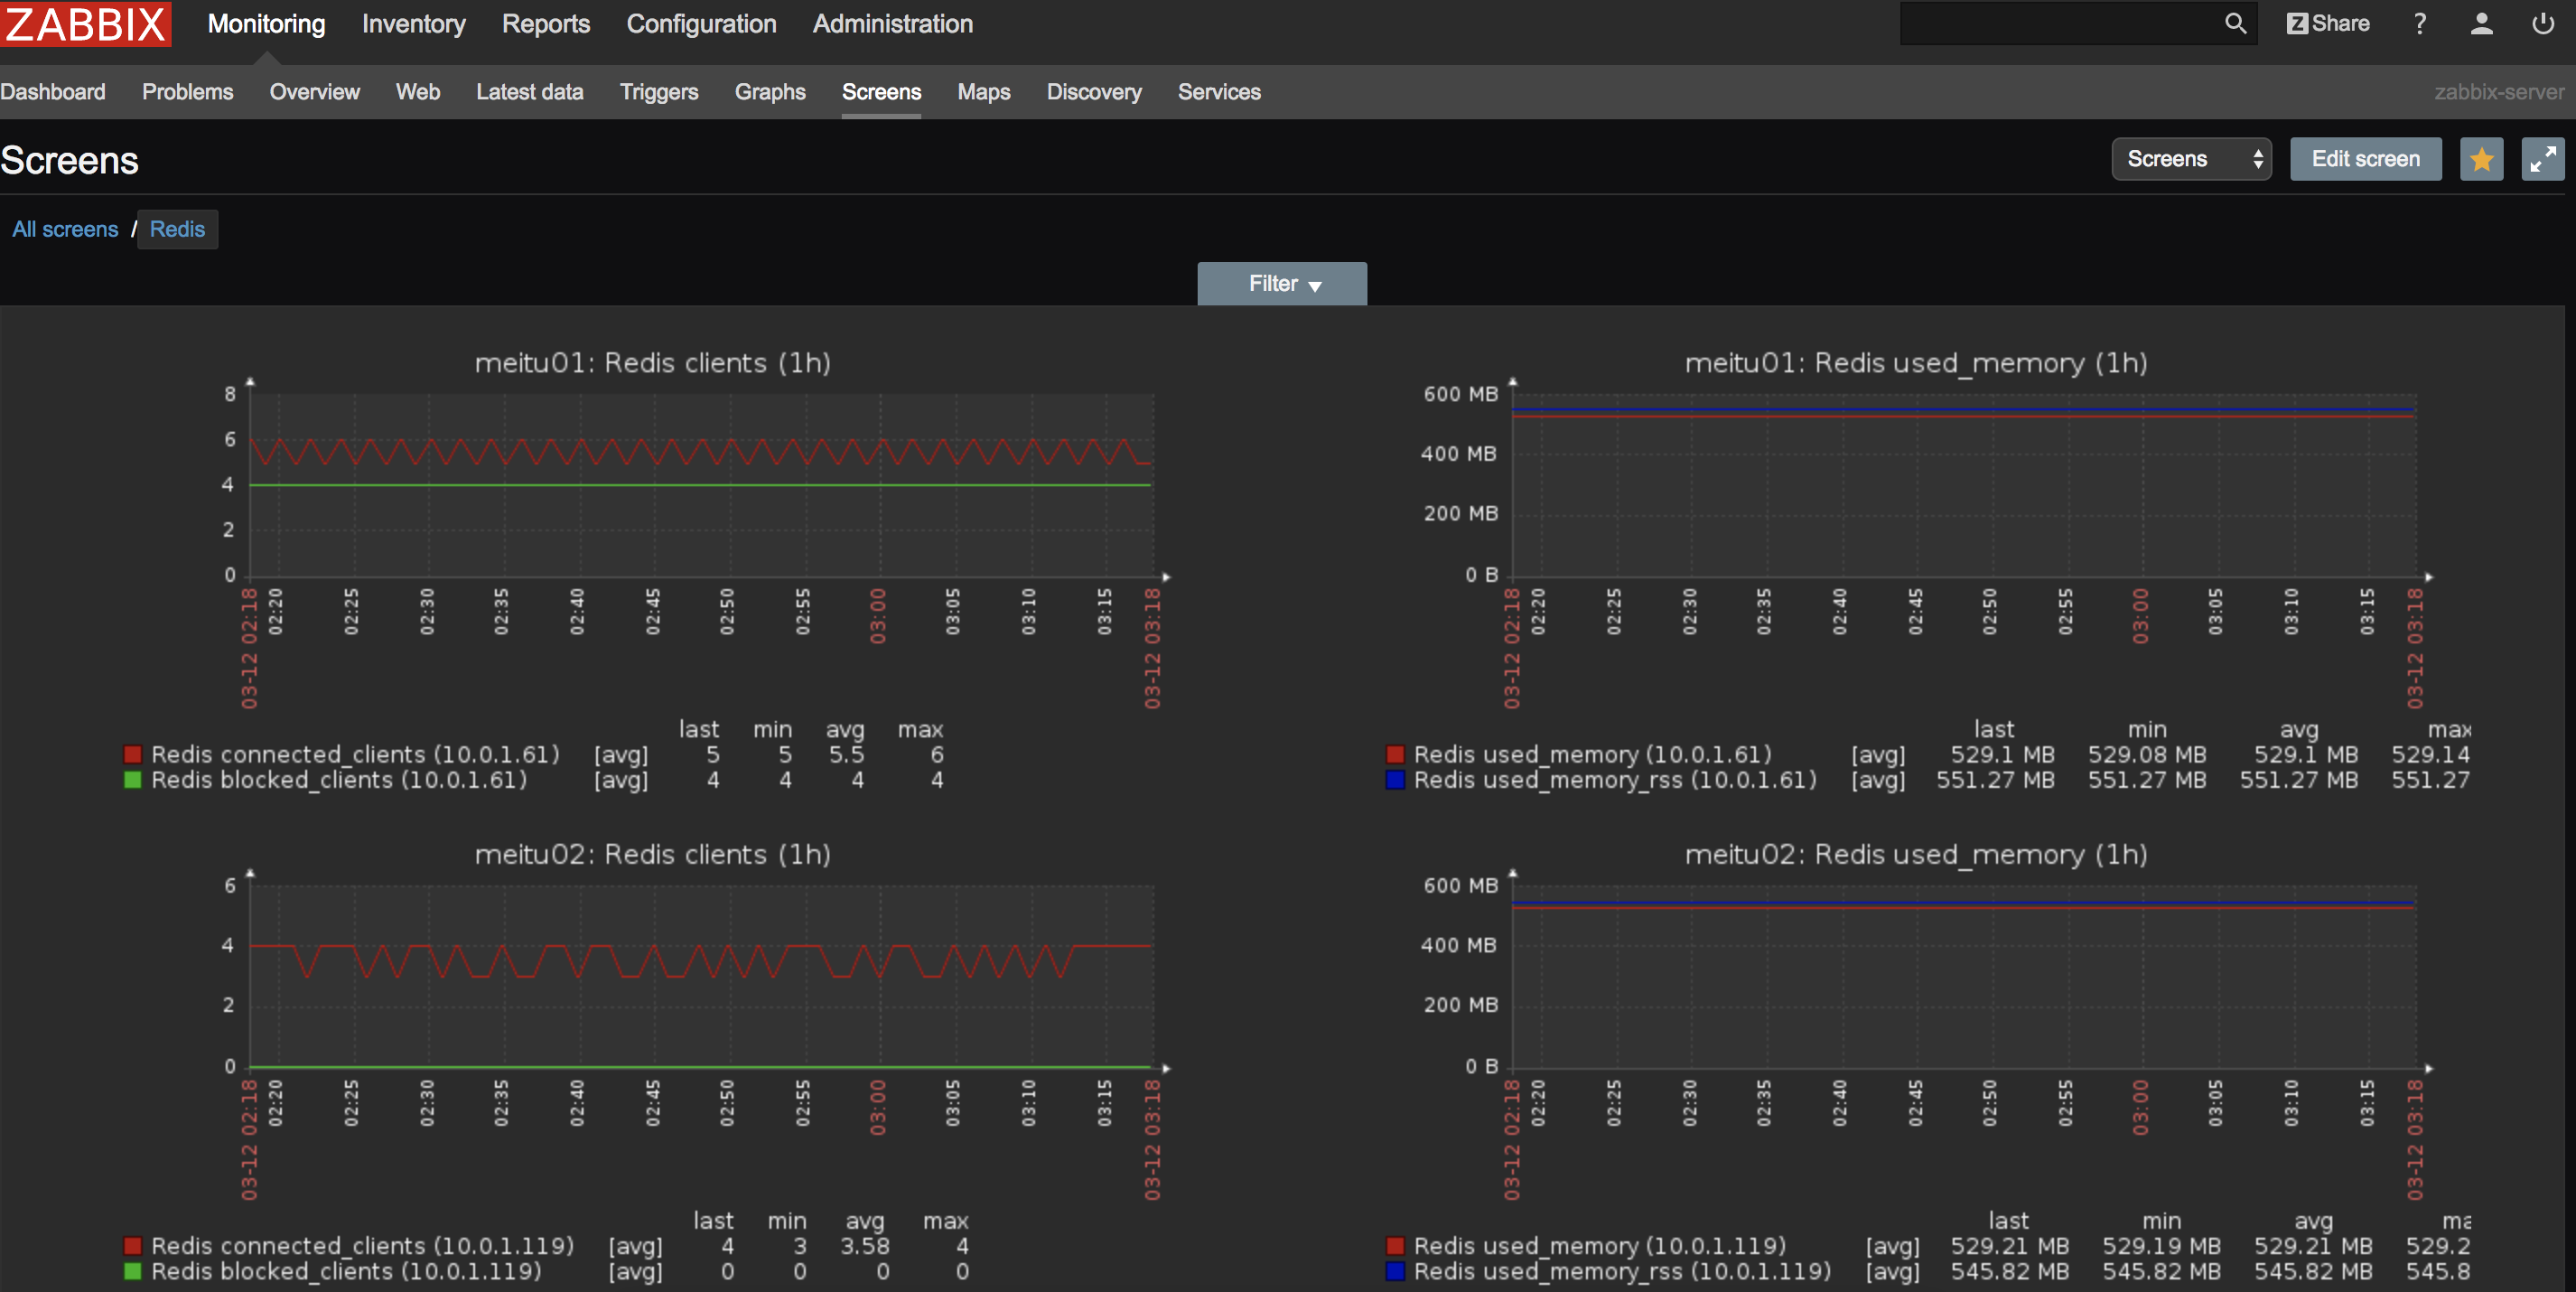
7、在web上导入 zbx_redis_templates.xml 模板。
导入之后,页面上马上报错 redis is down。这里需要修改一下端口,模板使用的是默认端口6379,改成自己的端口即可。

 浙公网安备 33010602011771号