
matlab设置bar图不同数据的颜色程序
转自百度贴吧
程序:
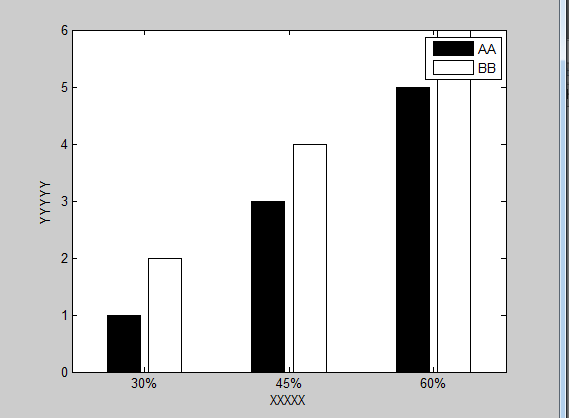
cheny=[1 2;3 4; 5 6];
b=bar(y);
ch = get(b,'children');
set(ch{1},'facecolor',[0 0 0])
set(ch{2},'facecolor',[1 1 1])
legend([ch{1} ch{2}],'AA','BB');
xlabel('XXXXX');
ylabel('YYYYY');
set(gca,'XTickLabel',{'30%','45%','60%'})
图:
转自百度贴吧

 浙公网安备 33010602011771号