

chart.js在html中画曲线图
http://www.bootcss.com/p/chart.js/docs/
http://www.chartjs.org/docs/ 中有详细讲解
一、简介
Chart.js是一个基于HTML5的简单的面向对象的图表库,支持包括IE7和8的所有现代浏览器。图表库中有6种表,分别是:曲线图(Linecharts)、柱状图(Barcharts)、雷达图(Radarcharts)、饼状图(Piecharts)、极坐标区域图(Polararea charts)以及圆环图(Doughnutcharts)。并且带有动画效果(animated),支持retina屏。
二、开始学习
①,首先Chart.js的官网地址是:http://www.chartjs.org/,可以从官网上下载JS文件。
然后加入到html文件中。
1 <script src="Chart.js" ></script>
②,曲线图(Line charts)
曲线图适合于表示数据的趋势变化,以及数据之间的对比。
测试代码如下:

  1 <html>
  2     <head>
  3         <title>TestChart.js</title>
  4         <script src="Chart.js" ></script>
  5     </head>
  6     <body>
  7         <canvas id="myChart" width="400" height="400"></canvas>
  8         <script type="text/javascript">
  9             var ctx = document.getElementById("myChart").getContext("2d");
 10             var data = {
 11                 /// 表现在X轴上的数据,数组形式
 12                 labels : ["January","February","March","April","May","June","July"],
 13                 /// 第一条线
 14                 datasets : [
 15                 {
 16                     /// 曲线的填充颜色
 17                     fillColor : "rgba(220,220,220,0.5)",
 18                     /// 填充块的边框线的颜色
 19                     strokeColor : "rgba(220,220,220,1)",
 20                     /// 表示数据的圆圈的颜色
 21                     pointColor : "rgba(220,220,220,1)",
 22                     /// 表示数据的圆圈的边的颜色
 23                     pointStrokeColor : "#fff",
 24                     data : [65,59,90,81,56,55,40]
 25                 },
 26                 /// 第二条线
 27                 {
 28                     fillColor : "rgba(151,187,205,0.5)",
 29                     strokeColor : "rgba(151,187,205,1)",
 30                     pointColor : "rgba(151,187,205,1)",
 31                     pointStrokeColor : "#fff",
 32                     data : [28,48,40,19,96,27,100]
 33                 }
 34                 ]
 35             }
 36             /// 动画效果
 37             var options = {
 38
 39                 //Boolean - If we show the scale above the chart data
 40                 scaleOverlay : false,
 41
 42                 //Boolean - If we want to override with a hard coded scale
 43                 scaleOverride : false,
 44
 45                 //** Required if scaleOverride is true **
 46                 //Number - The number of steps in a hard coded scale
 47                 scaleSteps : null,
 48                 //Number - The value jump in the hard coded scale
 49                 scaleStepWidth : null,
 50                 //Number - The scale starting value
 51                 scaleStartValue : null,
 52
 53                 //String - Colour of the scale line
 54                 scaleLineColor : "rgba(0,0,0,.1)",
 55
 56                 //Number - Pixel width of the scale line
 57                 scaleLineWidth : 1,
 58
 59                 //Boolean - Whether to show labels on the scale
 60                 scaleShowLabels : true,
 61
 62                 //Interpolated JS string - can access value
 63                 scaleLabel : "<%=value%>",
 64
 65                 //String - Scale label font declaration for the scale label
 66                 scaleFontFamily : "'Arial'",
 67
 68                 //Number - Scale label font size in pixels
 69                 scaleFontSize : 12,
 70
 71                 //String - Scale label font weight style
 72                 scaleFontStyle : "normal",
 73
 74                 //String - Scale label font colour
 75                 scaleFontColor : "#666",
 76
 77                 ///Boolean - Whether grid lines are shown across the chart
 78                 scaleShowGridLines : true,
 79
 80                 //String - Colour of the grid lines
 81                 scaleGridLineColor : "rgba(0,0,0,.05)",
 82
 83                 //Number - Width of the grid lines
 84                 scaleGridLineWidth : 1,
 85
 86                 //Boolean - Whether the line is curved between points
 87                 bezierCurve : true,
 88
 89                 //Boolean - Whether to show a dot for each point
 90                 pointDot : true,
 91
 92                 //Number - Radius of each point dot in pixels
 93                 pointDotRadius : 3,
 94
 95                 //Number - Pixel width of point dot stroke
 96                 pointDotStrokeWidth : 1,
 97
 98                 //Boolean - Whether to show a stroke for datasets
 99                 datasetStroke : true,
100
101                 //Number - Pixel width of dataset stroke
102                 datasetStrokeWidth : 2,
103
104                 //Boolean - Whether to fill the dataset with a colour
105                 datasetFill : true,
106
107                 //Boolean - Whether to animate the chart
108                 animation : true,
109
110                 //Number - Number of animation steps
111                 animationSteps : 60,
112
113                 //String - Animation easing effect
114                 animationEasing : "easeOutQuart",
115
116                 //Function - Fires when the animation is complete
117                 onAnimationComplete : null
118
119             }
120             /// 创建对象,生成图表
121             new Chart(ctx).Line(data,options);
122         </script>
123     </body>
124 </html>
效果如下: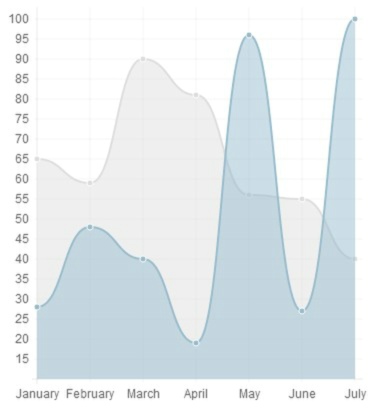
③,柱状图(Barcharts)
代码如下:
  1 <html>
  2     <head>
  3         <title>TestChart.js</title>
  4         <script src="Chart.js" ></script>
  5     </head>
  6     <body>
  7         <canvas id="myChart" width="400" height="400"></canvas>
  8         <script type="text/javascript">
  9             var ctx = document.getElementById("myChart").getContext("2d");
 10             var data = {
 11                 /// 表现在X轴上的数据,数组形式
 12                 labels : ["January","February","March","April","May","June","July"],
 13                 /// 第一条线
 14                 datasets : [
 15                 {
 16                     /// 填充颜色
 17                     fillColor : "red",
 18                     /// 填充块的边框线的颜色
 19                     strokeColor : "yellow",
 20                     data : [65,59,90,81,56,55,40]
 21                 },
 22                 /// 第二条线
 23                 {
 24                     fillColor : "blue",
 25                     strokeColor : "green",
 26                     data : [28,48,40,19,96,27,100]
 27                 }
 28                 ]
 29             }
 30             /// 动画效果
 31             var options = {
 32
 33                 //Boolean - If we show the scale above the chart data
 34                 scaleOverlay : false,
 35
 36                 //Boolean - If we want to override with a hard coded scale
 37                 scaleOverride : false,
 38
 39                 //** Required if scaleOverride is true **
 40                 //Number - The number of steps in a hard coded scale
 41                 scaleSteps : null,
 42                 //Number - The value jump in the hard coded scale
 43                 scaleStepWidth : null,
 44                 //Number - The scale starting value
 45                 scaleStartValue : null,
 46
 47                 //String - Colour of the scale line
 48                 scaleLineColor : "rgba(0,0,0,.1)",
 49
 50                 //Number - Pixel width of the scale line
 51                 scaleLineWidth : 1,
 52
 53                 //Boolean - Whether to show labels on the scale
 54                 scaleShowLabels : true,
 55
 56                 //Interpolated JS string - can access value
 57                 scaleLabel : "<%=value%>",
 58
 59                 //String - Scale label font declaration for the scale label
 60                 scaleFontFamily : "'Arial'",
 61
 62                 //Number - Scale label font size in pixels
 63                 scaleFontSize : 12,
 64
 65                 //String - Scale label font weight style
 66                 scaleFontStyle : "normal",
 67
 68                 //String - Scale label font colour
 69                 scaleFontColor : "#666",
 70
 71                 ///Boolean - Whether grid lines are shown across the chart
 72                 scaleShowGridLines : true,
 73
 74                 //String - Colour of the grid lines
 75                 scaleGridLineColor : "rgba(0,0,0,.05)",
 76
 77                 //Number - Width of the grid lines
 78                 scaleGridLineWidth : 1,
 79
 80                 //Boolean - Whether the line is curved between points
 81                 bezierCurve : true,
 82
 83                 //Boolean - Whether to show a dot for each point
 84                 pointDot : true,
 85
 86                 //Number - Radius of each point dot in pixels
 87                 pointDotRadius : 3,
 88
 89                 //Number - Pixel width of point dot stroke
 90                 pointDotStrokeWidth : 1,
 91
 92                 //Boolean - Whether to show a stroke for datasets
 93                 datasetStroke : true,
 94
 95                 //Number - Pixel width of dataset stroke
 96                 datasetStrokeWidth : 2,
 97
 98                 //Boolean - Whether to fill the dataset with a colour
 99                 datasetFill : true,
100
101                 //Boolean - Whether to animate the chart
102                 animation : true,
103
104                 //Number - Number of animation steps
105                 animationSteps : 60,
106
107                 //String - Animation easing effect
108                 animationEasing : "easeOutQuart",
109
110                 //Function - Fires when the animation is complete
111                 onAnimationComplete : null
112
113             }
114             /// 创建对象,生成图表
115             new Chart(ctx).Bar(data,options);
116         </script>
117     </body>
118 </html>
119
效果如下: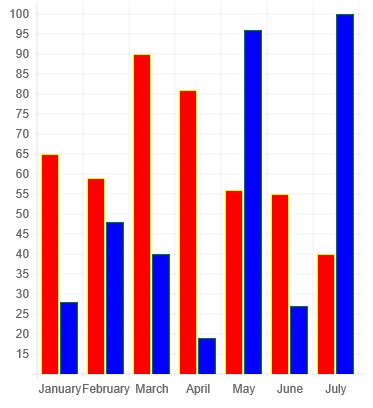
④,雷达图(Radar charts)
代码如下:
  1 <html>
  2     <head>
  3         <title>TestChart.js</title>
  4         <script src="Chart.js" ></script>
  5     </head>
  6     <body>
  7         <canvas id="myChart" width="400" height="400"></canvas>
  8         <script type="text/javascript">
  9             var ctx = document.getElementById("myChart").getContext("2d");
 10             var data = {
 11                     labels : ["Eating","Drinking","Sleeping","Designing","Coding","Partying","Running"],
 12                     datasets : [
 13                         {
 14                             fillColor : "rgba(220,220,220,0.5)",
 15                             strokeColor : "rgba(220,220,220,1)",
 16                             pointColor : "rgba(220,220,220,1)",
 17                             pointStrokeColor : "#fff",
 18                             data : [65,59,90,81,56,55,40]
 19                         },
 20                         {
 21                             fillColor : "rgba(151,187,205,0.5)",
 22                             strokeColor : "rgba(151,187,205,1)",
 23                             pointColor : "rgba(151,187,205,1)",
 24                             pointStrokeColor : "#fff",
 25                             data : [28,48,40,19,96,27,100]
 26                         }
 27                     ]
 28             }
 29             /// 动画效果
 30             var options = {
 31
 32     //Boolean - If we show the scale above the chart data
 33     scaleOverlay : false,
 34
 35     //Boolean - If we want to override with a hard coded scale
 36     scaleOverride : false,
 37
 38     //** Required if scaleOverride is true **
 39     //Number - The number of steps in a hard coded scale
 40     scaleSteps : null,
 41     //Number - The value jump in the hard coded scale
 42     scaleStepWidth : null,
 43     //Number - The centre starting value
 44     scaleStartValue : null,
 45
 46     //Boolean - Whether to show lines for each scale point
 47     scaleShowLine : true,
 48
 49     //String - Colour of the scale line
 50     scaleLineColor : "rgba(0,0,0,.1)",
 51
 52     //Number - Pixel width of the scale line
 53     scaleLineWidth : 1,
 54
 55     //Boolean - Whether to show labels on the scale
 56     scaleShowLabels : false,
 57
 58     //Interpolated JS string - can access value
 59     scaleLabel : "<%=value%>",
 60
 61     //String - Scale label font declaration for the scale label
 62     scaleFontFamily : "'Arial'",
 63
 64     //Number - Scale label font size in pixels
 65     scaleFontSize : 12,
 66
 67     //String - Scale label font weight style
 68     scaleFontStyle : "normal",
 69
 70     //String - Scale label font colour
 71     scaleFontColor : "#666",
 72
 73     //Boolean - Show a backdrop to the scale label
 74     scaleShowLabelBackdrop : true,
 75
 76     //String - The colour of the label backdrop
 77     scaleBackdropColor : "rgba(255,255,255,0.75)",
 78
 79     //Number - The backdrop padding above & below the label in pixels
 80     scaleBackdropPaddingY : 2,
 81
 82     //Number - The backdrop padding to the side of the label in pixels
 83     scaleBackdropPaddingX : 2,
 84
 85     //Boolean - Whether we show the angle lines out of the radar
 86     angleShowLineOut : true,
 87
 88     //String - Colour of the angle line
 89     angleLineColor : "rgba(0,0,0,.1)",
 90
 91     //Number - Pixel width of the angle line
 92     angleLineWidth : 1,
 93
 94     //String - Point label font declaration
 95     pointLabelFontFamily : "'Arial'",
 96
 97     //String - Point label font weight
 98     pointLabelFontStyle : "normal",
 99
100     //Number - Point label font size in pixels
101     pointLabelFontSize : 12,
102
103     //String - Point label font colour
104     pointLabelFontColor : "#666",
105
106     //Boolean - Whether to show a dot for each point
107     pointDot : true,
108
109     //Number - Radius of each point dot in pixels
110     pointDotRadius : 3,
111
112     //Number - Pixel width of point dot stroke
113     pointDotStrokeWidth : 1,
114
115     //Boolean - Whether to show a stroke for datasets
116     datasetStroke : true,
117
118     //Number - Pixel width of dataset stroke
119     datasetStrokeWidth : 2,
120
121     //Boolean - Whether to fill the dataset with a colour
122     datasetFill : true,
123
124     //Boolean - Whether to animate the chart
125     animation : true,
126
127     //Number - Number of animation steps
128     animationSteps : 60,
129
130     //String - Animation easing effect
131     animationEasing : "easeOutQuart",
132
133     //Function - Fires when the animation is complete
134     onAnimationComplete : null
135
136 }
137             /// 创建对象,生成图表
138             new Chart(ctx).Radar(data,options);
139         </script>
140     </body>
141 </html>
142
效果如下: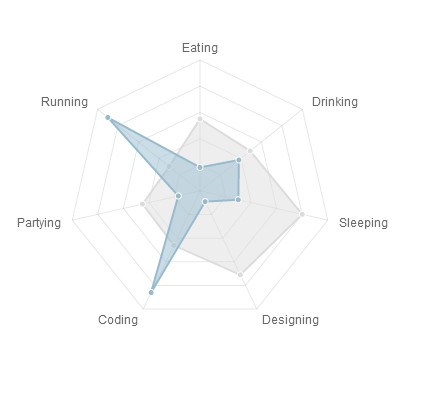
⑤,饼状图(Piecharts)
代码如下:
 1 <html>
 2     <head>
 3         <title>TestChart.js</title>
 4         <script src="Chart.js" ></script>
 5     </head>
 6     <body>
 7         <canvas id="myChart" width="400" height="400"></canvas>
 8         <script type="text/javascript">
 9             var ctx = document.getElementById("myChart").getContext("2d");
10             var data = [
11     {
12         value: 30,
13         color:"#F38630"
14     },
15     {
16         value : 50,
17         color : "#E0E4CC"
18     },
19     {
20         value : 100,
21         color : "#69D2E7"
22     }
23 ]
24             /// 动画效果
25             var options = {
26     //Boolean - Whether we should show a stroke on each segment
27     segmentShowStroke : true,
28
29     //String - The colour of each segment stroke
30     segmentStrokeColor : "#fff",
31
32     //Number - The width of each segment stroke
33     segmentStrokeWidth : 2,
34
35     //Boolean - Whether we should animate the chart
36     animation : true,
37
38     //Number - Amount of animation steps
39     animationSteps : 100,
40
41     //String - Animation easing effect
42     animationEasing : "easeOutBounce",
43
44     //Boolean - Whether we animate the rotation of the Pie
45     animateRotate : true,
46
47     //Boolean - Whether we animate scaling the Pie from the centre
48     animateScale : false,
49
50     //Function - Will fire on animation completion.
51     onAnimationComplete : null
52 }
53             /// 创建对象,生成图表
54             new Chart(ctx).Pie(data,options);
55         </script>
56     </body>
57 </html>
58
效果如下: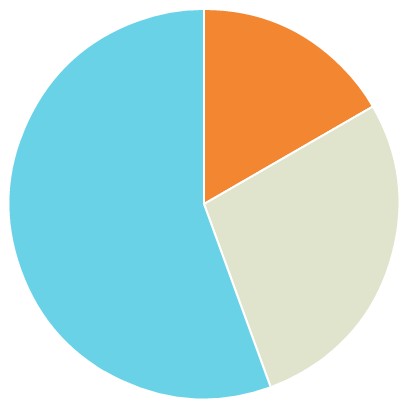
⑤,极坐标区域图(Polararea charts)
代码如下:
  1 <html>
  2     <head>
  3         <title>TestChart.js</title>
  4         <script src="Chart.js" ></script>
  5     </head>
  6     <body>
  7         <canvas id="myChart" width="400" height="400"></canvas>
  8         <script type="text/javascript">
  9             var ctx = document.getElementById("myChart").getContext("2d");
 10             var data = [
 11     {
 12         value : 30,
 13         color: "#D97041"
 14     },
 15     {
 16         value : 90,
 17         color: "#C7604C"
 18     },
 19     {
 20         value : 24,
 21         color: "#21323D"
 22     },
 23     {
 24         value : 58,
 25         color: "#9D9B7F"
 26     },
 27     {
 28         value : 82,
 29         color: "#7D4F6D"
 30     },
 31     {
 32         value : 8,
 33         color: "#584A5E"
 34     }
 35 ]
 36             /// 动画效果
 37             var options = {
 38
 39     //Boolean - Whether we show the scale above or below the chart segments
 40     scaleOverlay : true,
 41
 42     //Boolean - If we want to override with a hard coded scale
 43     scaleOverride : false,
 44
 45     //** Required if scaleOverride is true **
 46     //Number - The number of steps in a hard coded scale
 47     scaleSteps : null,
 48     //Number - The value jump in the hard coded scale
 49     scaleStepWidth : null,
 50     //Number - The centre starting value
 51     scaleStartValue : null,
 52
 53     //Boolean - Show line for each value in the scale
 54     scaleShowLine : true,
 55
 56     //String - The colour of the scale line
 57     scaleLineColor : "rgba(0,0,0,.1)",
 58
 59     //Number - The width of the line - in pixels
 60     scaleLineWidth : 1,
 61
 62     //Boolean - whether we should show text labels
 63     scaleShowLabels : true,
 64
 65     //Interpolated JS string - can access value
 66     scaleLabel : "<%=value%>",
 67
 68     //String - Scale label font declaration for the scale label
 69     scaleFontFamily : "'Arial'",
 70
 71     //Number - Scale label font size in pixels
 72     scaleFontSize : 12,
 73
 74     //String - Scale label font weight style
 75     scaleFontStyle : "normal",
 76
 77     //String - Scale label font colour
 78     scaleFontColor : "#666",
 79
 80     //Boolean - Show a backdrop to the scale label
 81     scaleShowLabelBackdrop : true,
 82
 83     //String - The colour of the label backdrop
 84     scaleBackdropColor : "rgba(255,255,255,0.75)",
 85
 86     //Number - The backdrop padding above & below the label in pixels
 87     scaleBackdropPaddingY : 2,
 88
 89     //Number - The backdrop padding to the side of the label in pixels
 90     scaleBackdropPaddingX : 2,
 91
 92     //Boolean - Stroke a line around each segment in the chart
 93     segmentShowStroke : true,
 94
 95     //String - The colour of the stroke on each segement.
 96     segmentStrokeColor : "#fff",
 97
 98     //Number - The width of the stroke value in pixels
 99     segmentStrokeWidth : 2,
100
101     //Boolean - Whether to animate the chart or not
102     animation : true,
103
104     //Number - Amount of animation steps
105     animationSteps : 100,
106
107     //String - Animation easing effect.
108     animationEasing : "easeOutBounce",
109
110     //Boolean - Whether to animate the rotation of the chart
111     animateRotate : true,
112
113     //Boolean - Whether to animate scaling the chart from the centre
114     animateScale : false,
115
116     //Function - This will fire when the animation of the chart is complete.
117     onAnimationComplete : null
118 }
119             /// 创建对象,生成图表
120             new Chart(ctx).PolarArea(data,options);
121         </script>
122     </body>
123 </html>
124
效果如下: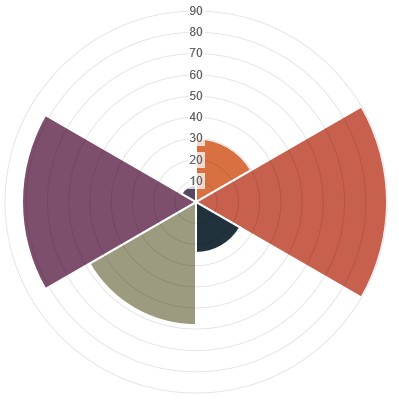
⑥,圆环图(Doughnutcharts)
代码如下:
 1 <html>
 2     <head>
 3         <title>TestChart.js</title>
 4         <script src="Chart.js" ></script>
 5     </head>
 6     <body>
 7         <canvas id="myChart" width="400" height="400"></canvas>
 8         <script type="text/javascript">
 9             var ctx = document.getElementById("myChart").getContext("2d");
10             var data = [
11     {
12         value: 30,
13         color:"#F7464A"
14     },
15     {
16         value : 50,
17         color : "#E2EAE9"
18     },
19     {
20         value : 100,
21         color : "#D4CCC5"
22     },
23     {
24         value : 40,
25         color : "#949FB1"
26     },
27     {
28         value : 120,
29         color : "#4D5360"
30     }
31
32 ]
33             /// 动画效果
34             var options = {
35     //Boolean - Whether we should show a stroke on each segment
36     segmentShowStroke : true,
37
38     //String - The colour of each segment stroke
39     segmentStrokeColor : "#fff",
40
41     //Number - The width of each segment stroke
42     segmentStrokeWidth : 2,
43
44     //The percentage of the chart that we cut out of the middle.
45     percentageInnerCutout : 50,
46
47     //Boolean - Whether we should animate the chart
48     animation : true,
49
50     //Number - Amount of animation steps
51     animationSteps : 100,
52
53     //String - Animation easing effect
54     animationEasing : "easeOutBounce",
55
56     //Boolean - Whether we animate the rotation of the Doughnut
57     animateRotate : true,
58
59     //Boolean - Whether we animate scaling the Doughnut from the centre
60     animateScale : false,
61
62     //Function - Will fire on animation completion.
63     onAnimationComplete : null
64 }
65             /// 创建对象,生成图表
66             new Chart(ctx).Doughnut(data,options);
67         </script>
68     </body>
69 </html>
70
效果如下: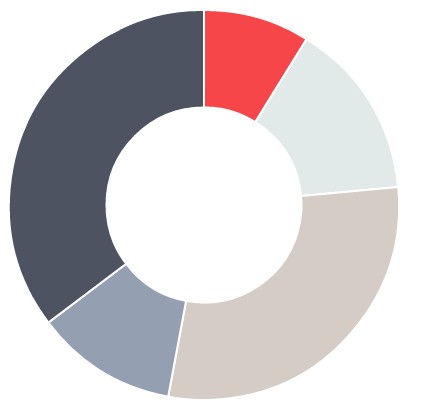
坚持就是胜利

 浙公网安备 33010602011771号