Linux 性能优化--理解 CPU 使用率和平均负载
1 理解CPU
CPU(Cental Processing Unit)是计算机系统的运算和控制核心,是信息处理、程序运行的最终执行单元,相当系统的“大脑”。
当 cpu 过于繁忙,就像“人脑”并发处理过多事情,会降低做事效率,严重时甚至会导致崩溃“宕机”。因此,理解 CPU 工作原理,合理控制资源,是保障系统稳定持续运行的重要手段。
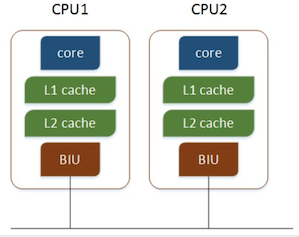
1.1 多 cpu 和多核 cpu
多个物理CPU,CPU通过总线进行通信,效率比较低:
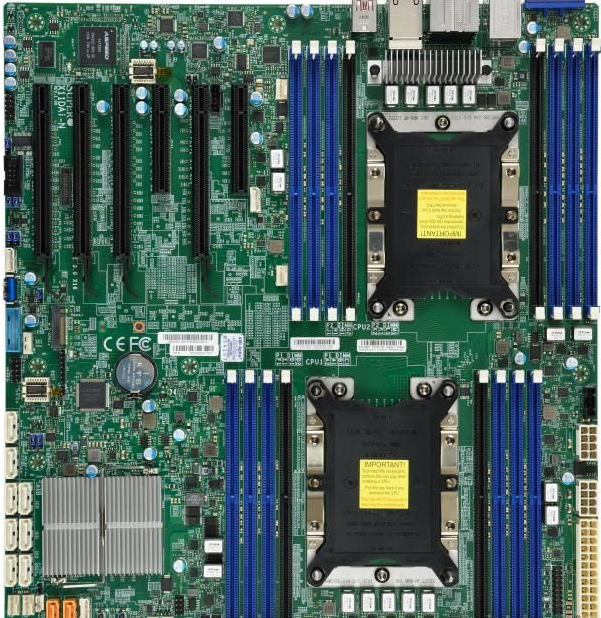
用于双路Xeon可扩展的主板:超微X11DAi-N
多核CPU,不同的核通过L2 cache进行通信,存储和外设通过总线与CPU通信:
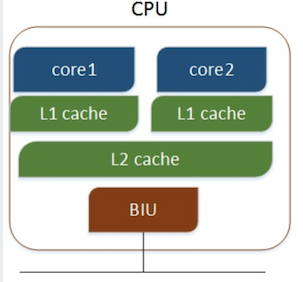
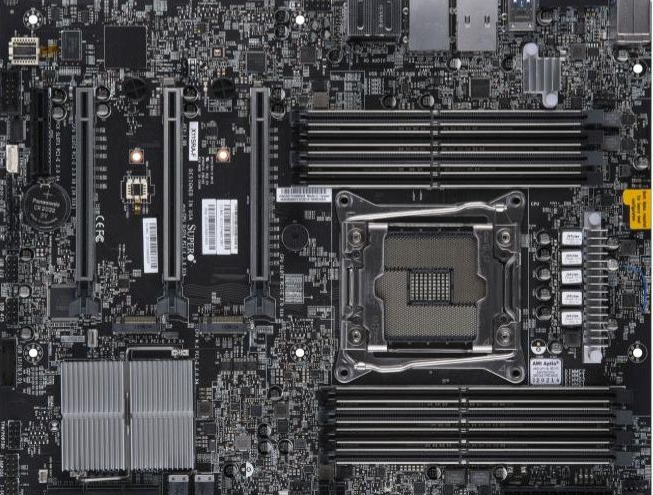
用于单路Xeon-W的主板:超微X11SRA
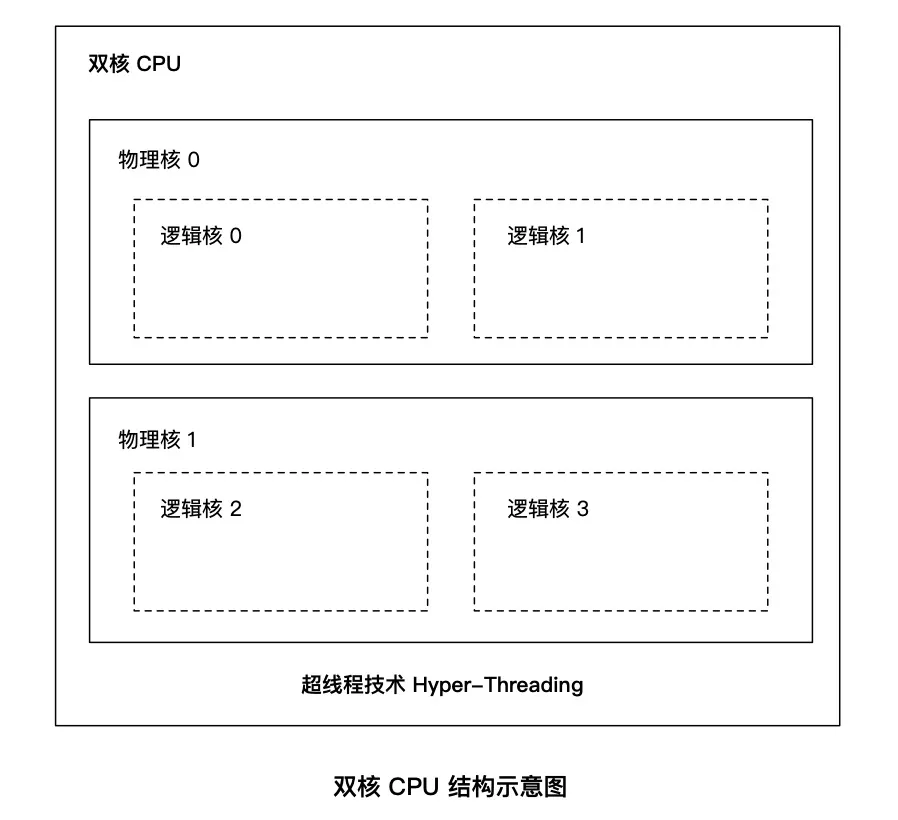
2 查询CPU信息
[root@localhost ~]# cat /proc/cpuinfo | grep 'physical id' | sort | uniq | wc -l  //查看 cpu 个数
2
[root@localhost ~]# cat /proc/cpuinfo | grep 'cpu cores' | sort | uniq     // 查看cpu物理核数
cpu cores    : 3
[root@localhost ~]# cat /proc/cpuinfo | grep 'siblings' | sort | uniq     // 查看 cpu 逻辑核数
siblings    : 3
3 平均负载含义
当系统变慢的时候,我们一般使用 top 或 uptime 命令来查看系统平均负载情况。
正确定义:单位时间内,系统中处于 可运行状态(R,Running/Runnable)和不可中断睡眠状态(D,Disk Sleep) 的平均进程数。
错误定义:单位时间内的 cpu 使用率。
可运行状态的进程:正在使用 cpu 或者正在等待 cpu 的进程,即 ps aux 命令下 STAT 处于 R 状态的进程
不可中断状态的进程:处于内核态关键流程中的进程,且不可被打断,如等待硬件设备IO响应,ps命令D状态的进程。
理想状态:每个 cpu 上都有一个活跃进程,即平均负载数等于 cpu 数。
过载经验值:平均负载高于 cpu 数量 70% 的时候。
假如在一个单 cpu 系统上看到 1.73 0.60 7.98,表示在过去一分钟内系统有73%的超载,而在15分钟内,有698%的超载。
注:可运行状态进程包括正在使用cpu或等待cpu的进程;不可中断状态进程是指处于内核关键流程中的进程,并且该流程不可被打断,比如当进程向磁盘写数据时,如果被打断,就可能出现磁盘数据与进程数据不一致。
不可中断进程状态,本质上是系统对进程和硬件设备的一种保护机制。
4 平均负载案例分析
系统环境和工具
系统环境和配置:CentOS 7 64bit 4G内存 2CPU
相关工具:stress、sysstat。
stress:一个Linux系统压力测试工具。
sysstat:监控和分析系统的性能工具,包括mpstat关于cpu详细信息(单独输出或分组输出)、pidstat(进程性能分析)命令、iostat等。
安装工具:yum install -y epel-release stress sysstat
同一个Linux系统开三个终端。
场景一:CPU密集型进程
第一个终端运行stress命令模拟一个cpu使用率100%
[root@localhost ~]# stress --cpu 1 --timeout 300
stress: info: [9716] dispatching hogs: 1 cpu, 0 io, 0 vm, 0 hdd
第二个终端运行uptime查看平均负载变化情况
#-d参数表示高亮显示变化的区域
[root@localhost ~]# watch -d uptime
第三个终端云溪mpstat查看cpu使用率变化情况
#-P ALL表示监控所有cpu,5表示间隔5秒输出一组数据
[root@localhost zhiwenwei]# mpstat -P ALL 5
Linux 3.10.0-957.10.1.el7.x86_64 (localhost.localdomain)     2019年04月01日     _x86_64_    (2 CPU)

22时33分45秒  CPU    %usr   %nice    %sys %iowait    %irq   %soft  %steal  %guest  %gnice   %idle
22时33分50秒  all   50.95    0.00    0.30    0.00    0.00    0.00    0.00    0.00    0.00   48.75
22时33分50秒    0    1.80    0.00    0.60    0.00    0.00    0.00    0.00    0.00    0.00   97.60
22时33分50秒    1  100.00    0.00    0.00    0.00    0.00    0.00    0.00    0.00    0.00    0.00
结论:从终端二看到1分钟的平均负载会慢慢增加到1.00;终端三正好有一个cpu使用率为100%,但它的iowait只有0,说明平均负载的升高正是由于cpu使用率的升高。
那么到底是哪个进程导致cpu使用率为100%,可以使用top命令来来查或使用pidstat命令。
[root@localhost zhiwenwei]# pidstat -u 5 1
Linux 3.10.0-957.10.1.el7.x86_64 (localhost.localdomain)     2019年04月01日     _x86_64_    (2 CPU)

22时37分09秒   UID       PID    %usr %system  %guest   %wait    %CPU   CPU  Command
22时37分14秒     0      2334    0.00    0.20    0.00    0.00    0.20     0  xfsaild/dm-0
22时37分14秒     0      4805    1.20    0.20    0.00    0.00    1.40     0  mono
22时37分14秒     0      4808    0.00    0.20    0.00    0.00    0.20     0  rsyslogd
22时37分14秒     0      9783    0.00    0.20    0.00    0.00    0.20     0  watch
22时37分14秒     0     10078  100.20    0.00    0.00    0.00  100.20     1  stress
22时37分14秒     0     10087    0.20    0.20    0.00    0.00    0.40     0  pidstat

平均时间:   UID       PID    %usr %system  %guest   %wait    %CPU   CPU  Command
平均时间:     0      2334    0.00    0.20    0.00    0.00    0.20     -  xfsaild/dm-0
平均时间:     0      4805    1.20    0.20    0.00    0.00    1.40     -  mono
平均时间:     0      4808    0.00    0.20    0.00    0.00    0.20     -  rsyslogd
平均时间:     0      9783    0.00    0.20    0.00    0.00    0.20     -  watch
平均时间:     0     10078  100.20    0.00    0.00    0.00  100.20     -  stress
平均时间:     0     10087    0.20    0.20    0.00    0.00    0.40     -  pidstat
场景二:I/O密集型进程
第一个终端运行stress命令模拟I/O压力
[root@localhost ~]# stress -i 1 --timeout 600
第二个终端运行uptime查看当前平均负载变化情况
[root@localhost ~]# watch -d uptime
第三个终端运行mpstat查看cpu使用率变化情况
[zhiwenwei@localhost tmp]$ mpstat -P ALL 5 1
Linux 3.10.0-957.10.1.el7.x86_64 (localhost.localdomain)     2019年04月02日     _x86_64_    (2 CPU)

13时44分56秒  CPU    %usr   %nice    %sys %iowait    %irq   %soft  %steal  %guest  %gnice   %idle
13时45分01秒  all    1.41    0.00   47.43    0.00    0.00    0.00    0.00    0.00    0.00   51.16
13时45分01秒    0    1.61    0.00   89.52    0.00    0.00    0.00    0.00    0.00    0.00    8.87
13时45分01秒    1    1.21    0.00    5.43    0.00    0.00    0.00    0.00    0.00    0.00   93.36

平均时间:  CPU    %usr   %nice    %sys %iowait    %irq   %soft  %steal  %guest  %gnice   %idle
平均时间:  all    1.41    0.00   47.43    0.00    0.00    0.00    0.00    0.00    0.00   51.16
平均时间:    0    1.61    0.00   89.52    0.00    0.00    0.00    0.00    0.00    0.00    8.87
平均时间:    1    1.21    0.00    5.43    0.00    0.00    0.00    0.00    0.00    0.00   93.36
结论:1分钟的平均负载会慢慢增加到1,其中两个cpu平均使用率49.40,而idle平均达到50.40。说明平均负载的升高由于idle的升高。
查看导致idle升高的进程:
[zhiwenwei@localhost tmp]$ pidstat -u 5 1
Linux 3.10.0-957.10.1.el7.x86_64 (localhost.localdomain)     2019年04月02日     _x86_64_    (2 CPU)

13时50分46秒   UID       PID    %usr %system  %guest   %wait    %CPU   CPU  Command
13时50分51秒     0      4273    0.00    8.58    0.00    1.60    8.58     0  kworker/u4:0
13时50分51秒     0      4805    1.40    0.00    0.00    0.00    1.40     1  mono
13时50分51秒     0      4815    1.00   62.08    0.00    3.59   63.07     0  stress
13时50分51秒     0      4816    0.00   14.77    0.00    1.60   14.77     1  kworker/u4:1
13时50分51秒  1007      4819    0.00    0.20    0.00    0.00    0.20     1  pidstat

平均时间:   UID       PID    %usr %system  %guest   %wait    %CPU   CPU  Command
平均时间:     0      4273    0.00    8.58    0.00    1.60    8.58     -  kworker/u4:0
平均时间:     0      4805    1.40    0.00    0.00    0.00    1.40     -  mono
平均时间:     0      4815    1.00   62.08    0.00    3.59   63.07     -  stress
平均时间:     0      4816    0.00   14.77    0.00    1.60   14.77     -  kworker/u4:1
平均时间:  1007      4819    0.00    0.20    0.00    0.00    0.20     -  pidstat
可以发现是stress进程导致的。
场景三:大量进程
第一个终端使用stress命令模拟10个进程
[root@localhost ~]# stress -c 10 --timeout 600
第二个终端用uptime查看平均负载变化情况
[root@localhost ~]# watch -d uptime
第三个终端pidstat查看进程情况
[root@localhost ~]# pidstat -u 5 1
Linux 3.10.0-957.10.1.el7.x86_64 (localhost.localdomain)     2019年04月02日     _x86_64_    (2 CPU)

13时55分59秒   UID       PID    %usr %system  %guest   %wait    %CPU   CPU  Command
13时56分04秒     0      4805    1.38    0.20    0.00    0.00    1.58     0  mono
13时56分04秒     0      4828   19.53    0.00    0.00   79.49   19.53     0  stress
13时56分04秒     0      4829   19.72    0.00    0.00   79.49   19.72     0  stress
13时56分04秒     0      4830   19.72    0.00    0.00   79.68   19.72     1  stress
13时56分04秒     0      4831   19.72    0.00    0.00   79.68   19.72     0  stress
13时56分04秒     0      4832   19.53    0.00    0.00   79.09   19.53     0  stress
13时56分04秒     0      4833   19.72    0.00    0.00   79.29   19.72     1  stress
13时56分04秒     0      4834   19.53    0.00    0.00   78.90   19.53     1  stress
13时56分04秒     0      4835   19.72    0.00    0.00   80.08   19.72     1  stress
13时56分04秒     0      4836   19.53    0.00    0.00   79.09   19.53     0  stress
13时56分04秒     0      4837   19.72    0.00    0.00   79.29   19.72     1  stress
13时56分04秒     0      4848    0.00    0.20    0.00    0.39    0.20     0  pidstat

平均时间:   UID       PID    %usr %system  %guest   %wait    %CPU   CPU  Command
平均时间:     0      4805    1.38    0.20    0.00    0.00    1.58     -  mono
平均时间:     0      4828   19.53    0.00    0.00   79.49   19.53     -  stress
平均时间:     0      4829   19.72    0.00    0.00   79.49   19.72     -  stress
平均时间:     0      4830   19.72    0.00    0.00   79.68   19.72     -  stress
平均时间:     0      4831   19.72    0.00    0.00   79.68   19.72     -  stress
平均时间:     0      4832   19.53    0.00    0.00   79.09   19.53     -  stress
平均时间:     0      4833   19.72    0.00    0.00   79.29   19.72     -  stress
平均时间:     0      4834   19.53    0.00    0.00   78.90   19.53     -  stress
平均时间:     0      4835   19.72    0.00    0.00   80.08   19.72     -  stress
平均时间:     0      4836   19.53    0.00    0.00   79.09   19.53     -  stress
平均时间:     0      4837   19.72    0.00    0.00   79.29   19.72     -  stress
平均时间:     0      4848    0.00    0.20    0.00    0.39    0.20     -  pidstat
总结:
平均负载高有可能是cpu密集型进程导致的;
平均负载高不一定是cpu使用率高,还有可能是I/O更繁忙
当发现负载高的时候,可以使用mpstat、pidstat等工具辅助分析负载高的根源。
参考文献

 浙公网安备 33010602011771号