

Prometheus 部署 +grafana + 报警 + 邮箱
环境:
服务器A:prometheus
服务器B:被监控端
软件:
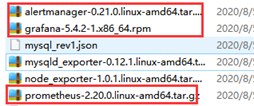
标红的传到prometheus端,其余的传到被监控端
安装前时间同步:否则会出错

解决就是时间同步:
[root@localhost ~]# yum -y install ntpdate
[root@localhost ~]# ntpdate cn.pool.ntp.org
安装prometheus :
[root@192 ~]# cd /usr/local/src/
[root@192 src]# ll
总用量 142600
-rw-r--r--. 1 root root 25710888 8月   5 19:47 alertmanager-0.21.0.linux-amd64.tar.gz
-rw-r--r--. 1 root root 54991977 8月   5 19:47 grafana-5.4.2-1.x86_64.rpm
-rw-r--r--. 1 root root 65312139 8月   5 19:47 prometheus-2.20.0.linux-amd64.tar.gz
[root@192 src]# tar zxf prometheus-2.20.0.linux-amd64.tar.gz
[root@192 src]# mkdir /usr/local/prometeus
[root@192 src]# mv prometheus-2.20.0.linux-amd64/* /usr/local/prometeus/
[root@192 src]# cd /usr/local/prometeus/
[root@192 prometeus]# ls
console_libraries  consoles  LICENSE  NOTICE  prometheus  prometheus.yml  promtool  tsdb
[root@192 prometeus]# ./prometheus  #前台启动

[root@192 prometeus]# nohup ./prometheus &   #后台启动 生成nohup.out文件

[root@192 prometeus]# ll
总用量 153588
drwxr-xr-x. 2 3434 3434       38 7月  23 05:00 console_libraries
drwxr-xr-x. 2 3434 3434      173 7月  23 05:00 consoles
drwxr-xr-x. 4 root root       70 8月   5 20:12 data
-rw-r--r--. 1 3434 3434    11357 7月  23 05:00 LICENSE
-rw-------. 1 root root     2374 8月   5 20:13 nohup.out
-rw-r--r--. 1 3434 3434     3420 7月  23 05:00 NOTICE
-rwxr-xr-x. 1 3434 3434 90933367 7月  23 02:53 prometheus
-rw-r--r--. 1 3434 3434      926 7月  23 05:00 prometheus.yml
-rwxr-xr-x. 1 3434 3434 51151585 7月  23 02:55 promtool
-rwxr-xr-x. 1 3434 3434 15159115 7月  23 02:56 tsdb
[root@192 prometeus]# tailf nohup.out  #实时打印日志
[root@192 prometeus]# vim prometheus.yml
alerting:
  alertmanagers:
  - static_configs:
    - targets:
      # - alertmanager:9093   #打开报警

rule_files:
  # - "first_rules.yml"
  # - "second_rules.yml"        #报警规则

- job_name: 'prometheus'

    # metrics_path defaults to '/metrics'
    # scheme defaults to 'http'.

    static_configs:
    - targets: ['localhost:9090']  #监控本机

- job_name: 'node_exporter'

    # metrics_path defaults to '/metrics'
    # scheme defaults to 'http'.

    static_configs:
    - targets: ['192.168.177.142:9100']  #监控被监控端
被监控端:
[root@192 ~]# cd /usr/local/src/
[root@192 src]# ll
总用量 16388
-rw-r--r--. 1 root root 7121565 8月   5 19:47 mysqld_exporter-0.12.1.linux-amd64.tar.gz
-rw-r--r--. 1 root root  134391 8月   5 19:47 mysql_rev1.json
-rw-r--r--. 1 root root 9520728 8月   5 19:47 node_exporter-1.0.1.linux-amd64.tar.gz
[root@192 src]# tar zxf node_exporter-1.0.1.linux-amd64.tar.gz
[root@192 src]# mkdir /usr/local/node_exporter
[root@192 src]# mv node_exporter-1.0.1.linux-amd64 /usr/local/node_exporter/
[root@192 src]# cd /usr/local/node_exporter/
[root@192 node_exporter]# ll
总用量 0
drwxr-xr-x. 2 3434 3434 56 6月  16 21:19 node_exporter-1.0.1.linux-amd64
[root@192 node_exporter]# cd node_exporter-1.0.1.linux-amd64/
[root@192 node_exporter-1.0.1.linux-amd64]# ll
总用量 19216
-rw-r--r--. 1 3434 3434    11357 6月  16 21:19 LICENSE
-rwxr-xr-x. 1 3434 3434 19657731 6月  16 20:44 node_exporter
-rw-r--r--. 1 3434 3434      463 6月  16 21:19 NOTICE
[root@192 node_exporter-1.0.1.linux-amd64]# ./node_exporter #启动服务前台
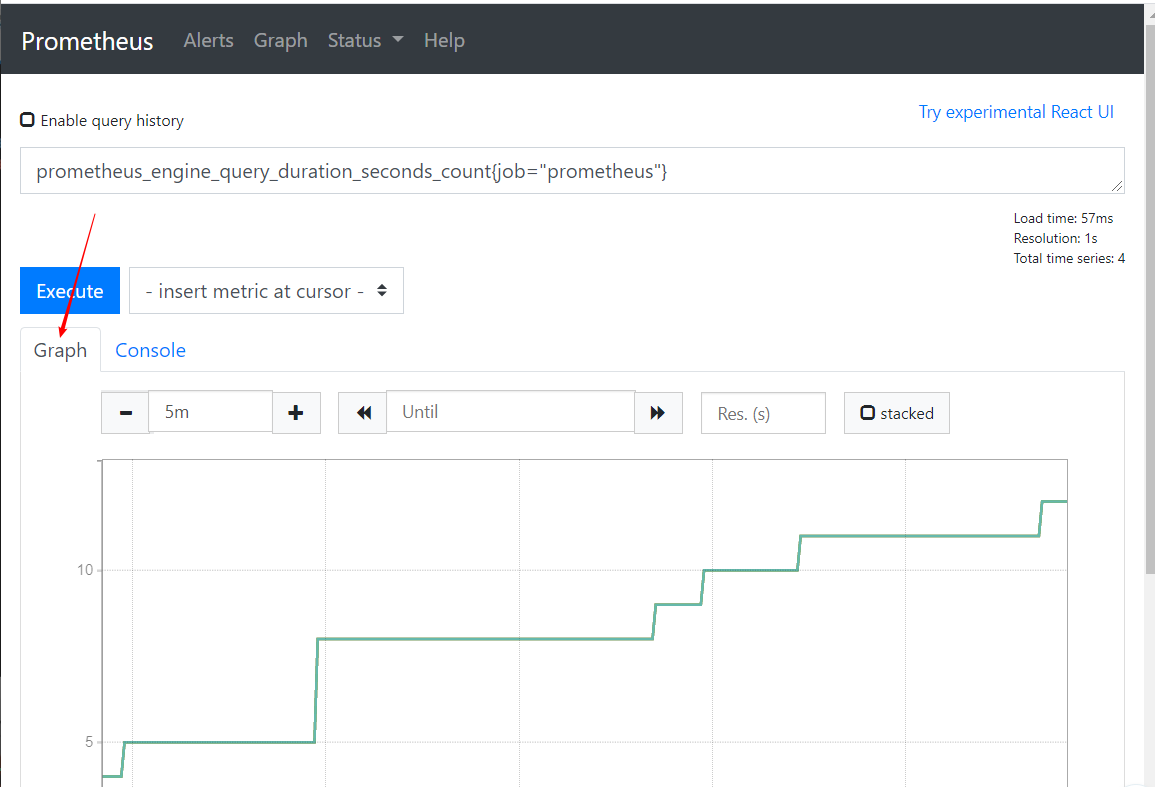
web检测:192.168.177.252:9090
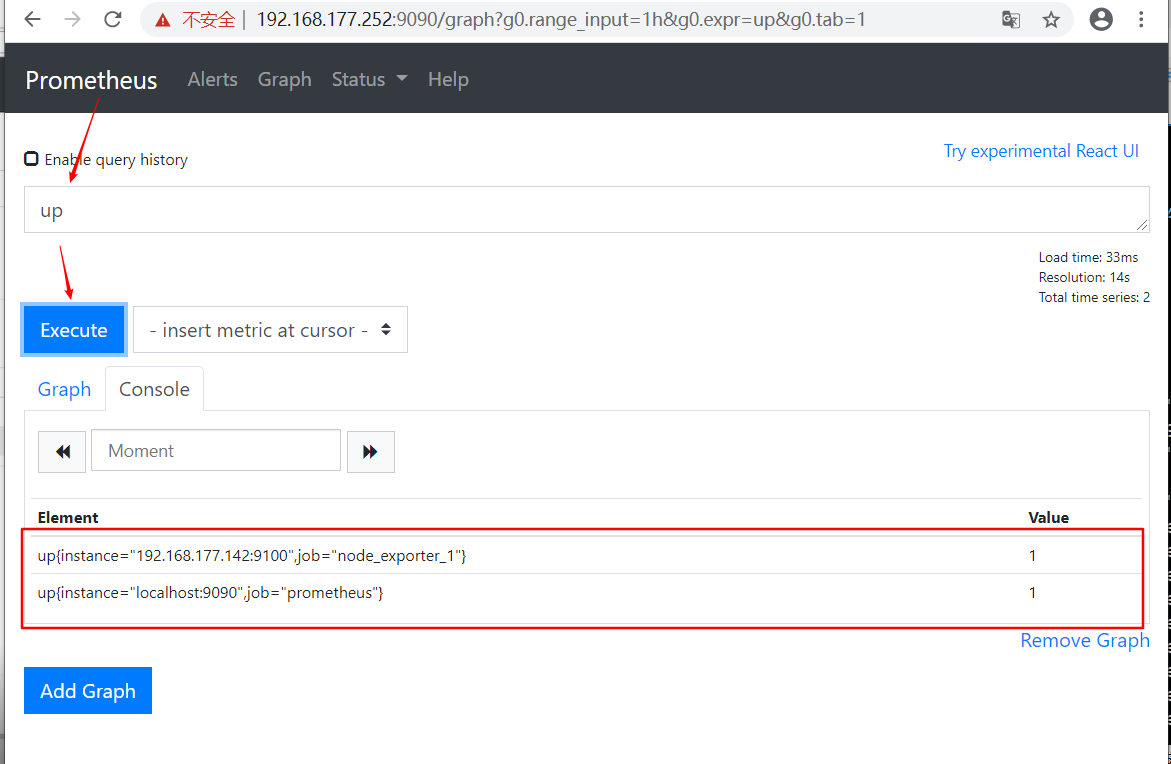
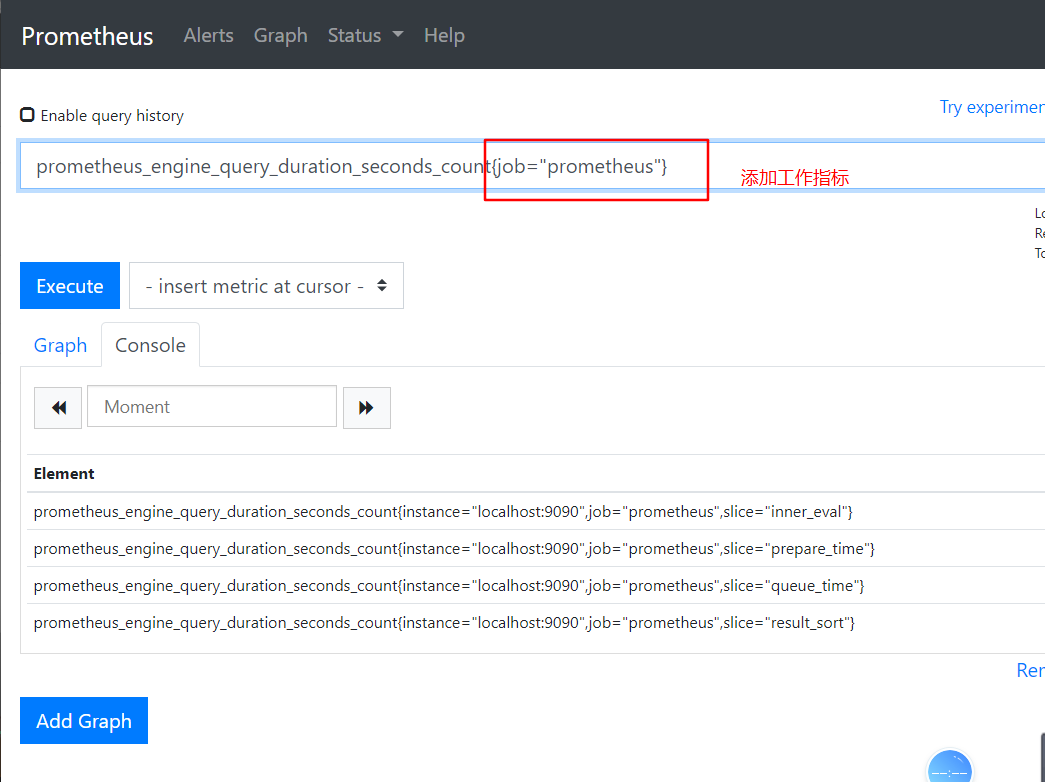
查看数据指标
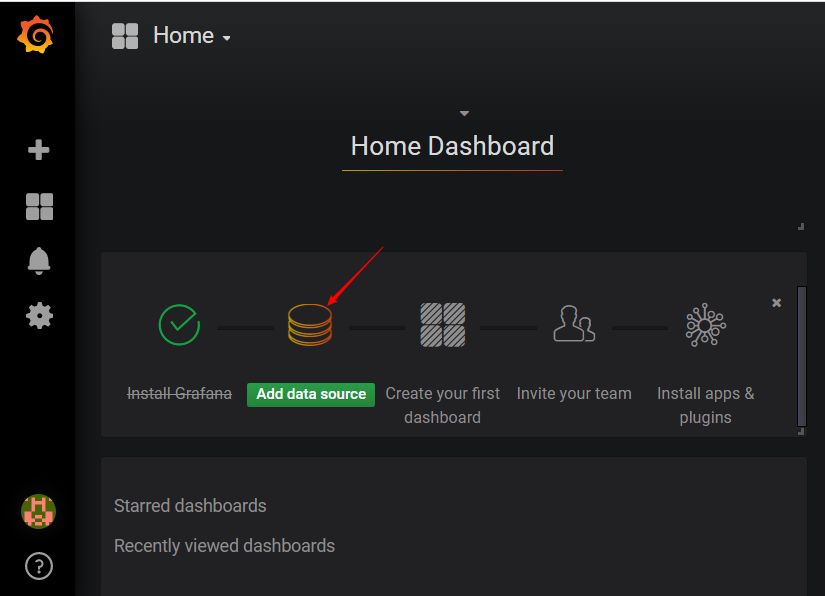
下面要结合grafana来进行监控:
安装grafana
[root@192 src]# rpm -ivh --nodeps grafana-5.4.2-1.x86_64.rpm  #会有依赖 加上--nodeps
[root@192 src]# systemctl daemon-reload
[root@192 src]# systemctl restart grafana-server
[root@192 src]# systemctl status grafana-server
● grafana-server.service - Grafana instance
   Loaded: loaded (/usr/lib/systemd/system/grafana-server.service; disabled; vendor preset: disabled)
   Active: active (running) since 三 2020-08-05 21:00:49 CST; 16s ago
web访问:ip+3000
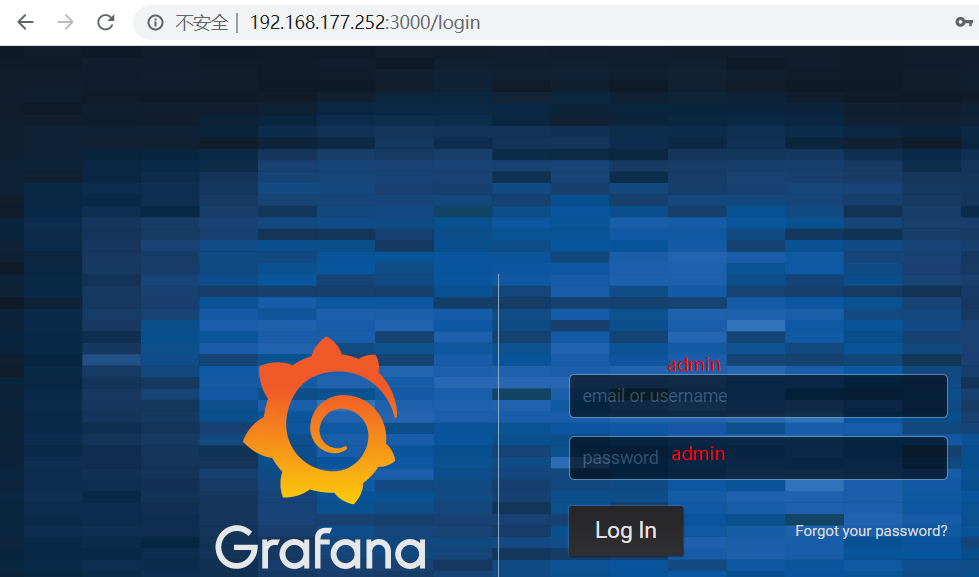
之后改密码:自己随便改:

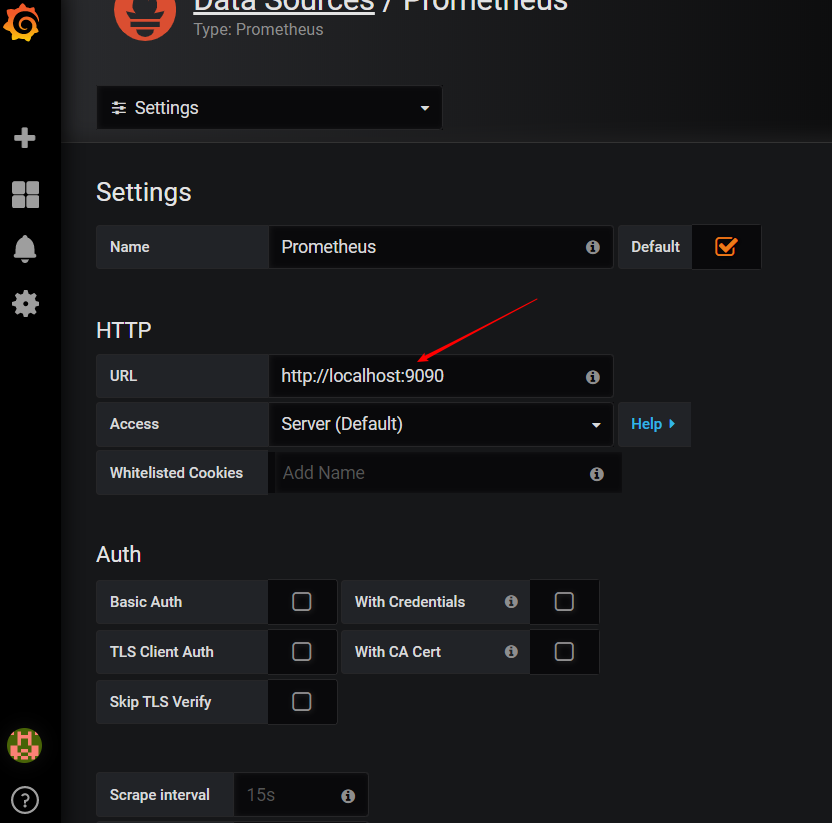
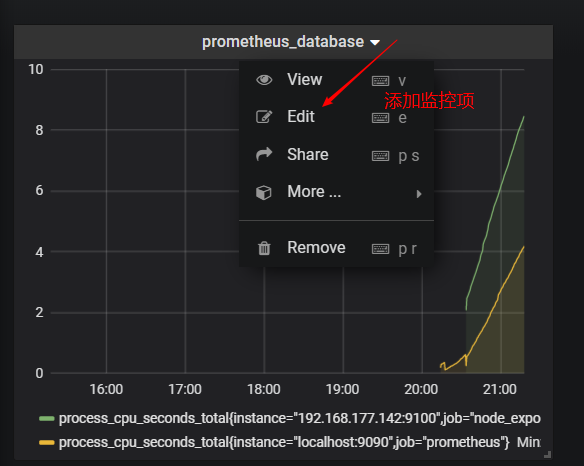
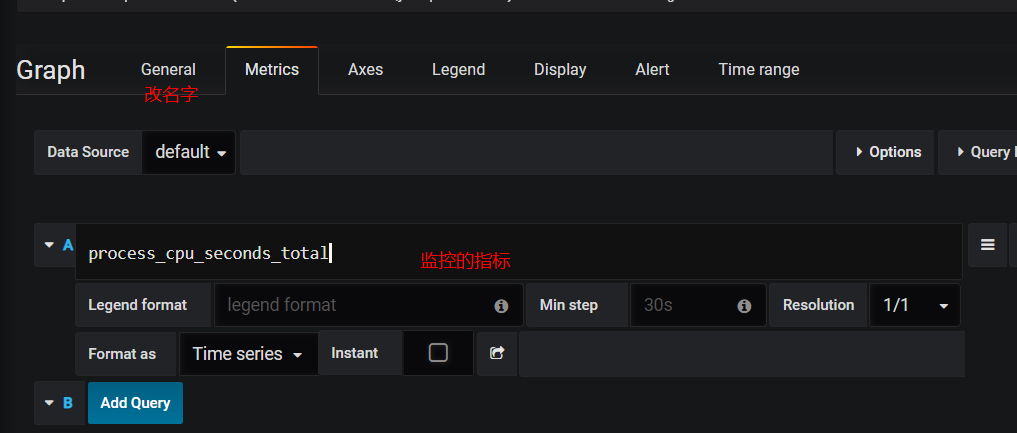
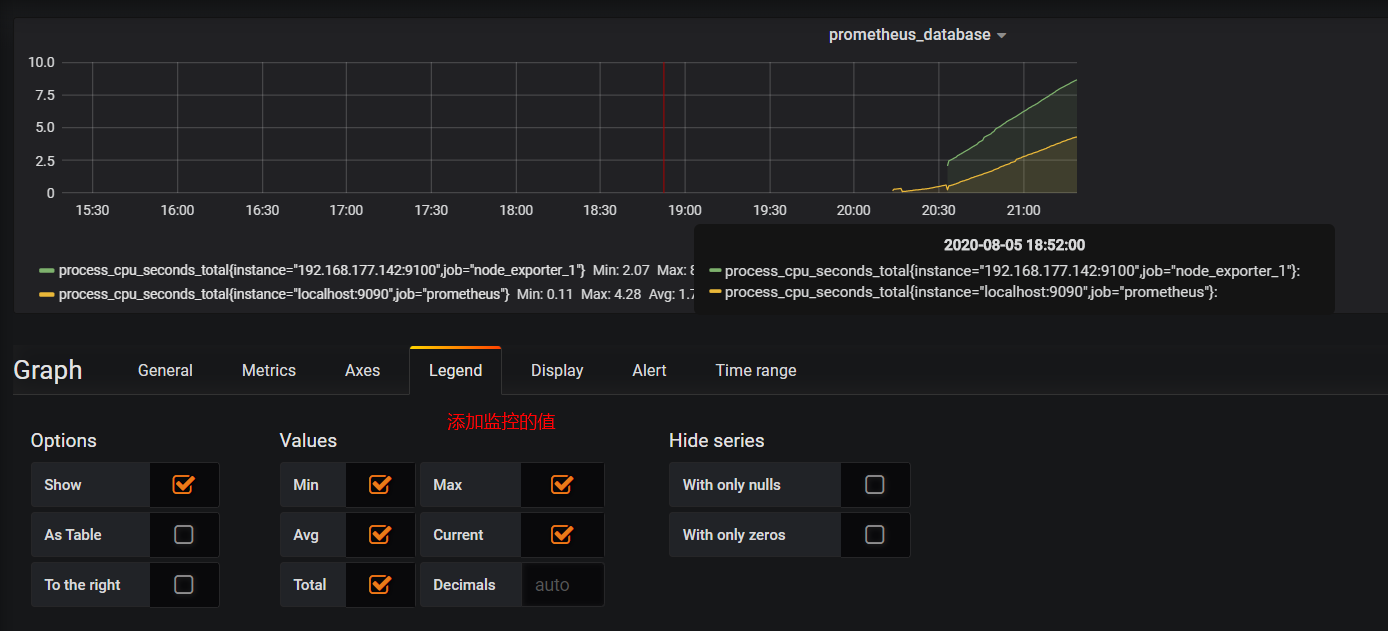
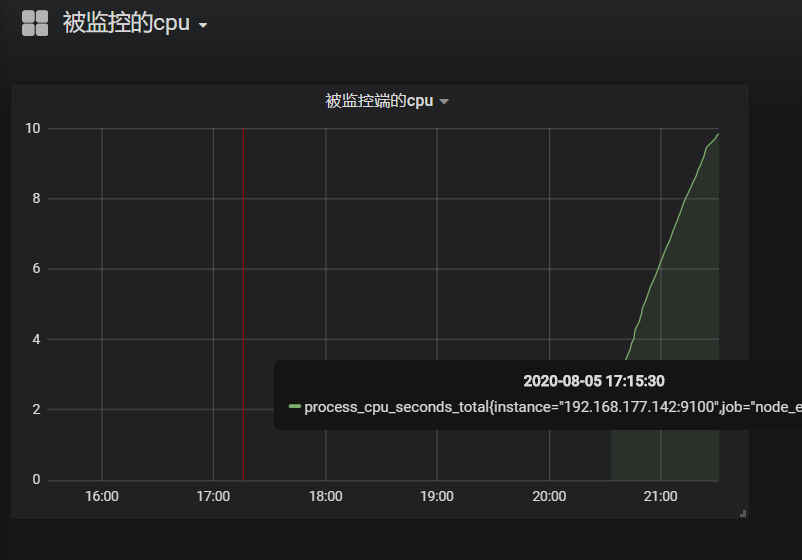
监控的本机
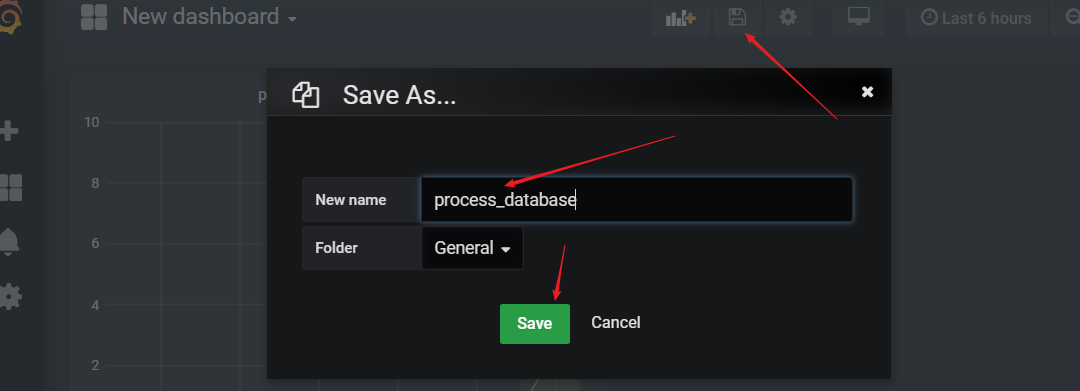
保存
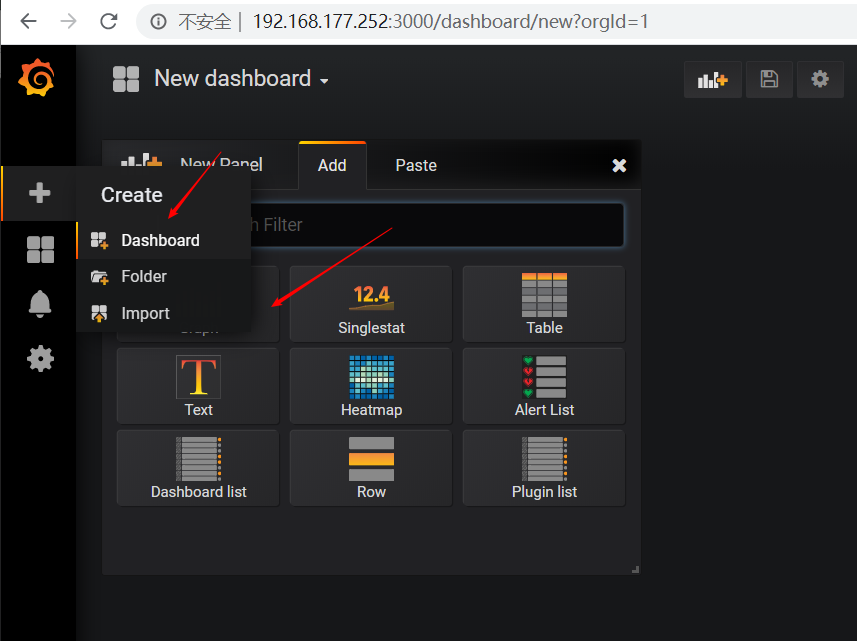
监控被监控端
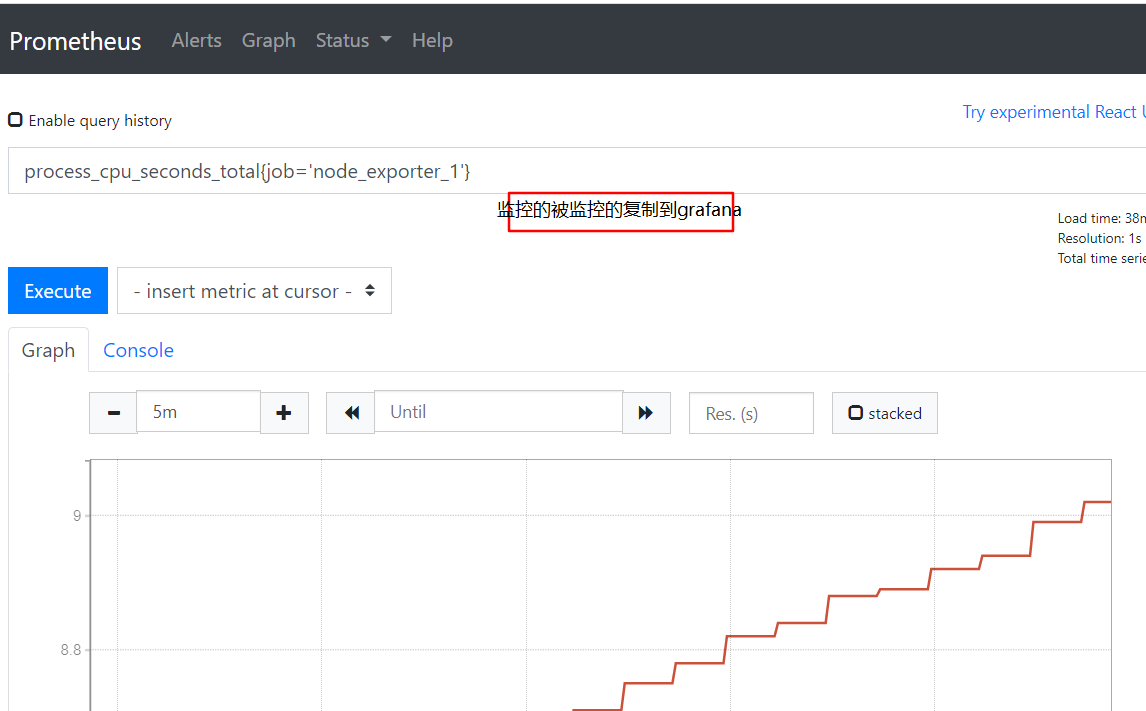
插入与上面重复一样:
报警机制的选择:
[root@192 prometeus]# vim prometheus.yml
[root@192 prometeus]# vim first_rules.yml
groups:
- name: node_exporter_1 alert rule
  rules:
  - alert: node_exporter_1Down
    expr: sum(up{job="node_exporter_1"}) == 0
    for: 10s
    labels:
      severity: critical
[root@192 prometeus]# vim prometheus.yml
rule_files:
- "first_rules.yml"     拖进来
# - "first_rules.yml"
# - "second_rules.yml" ~
停掉监控端查看:
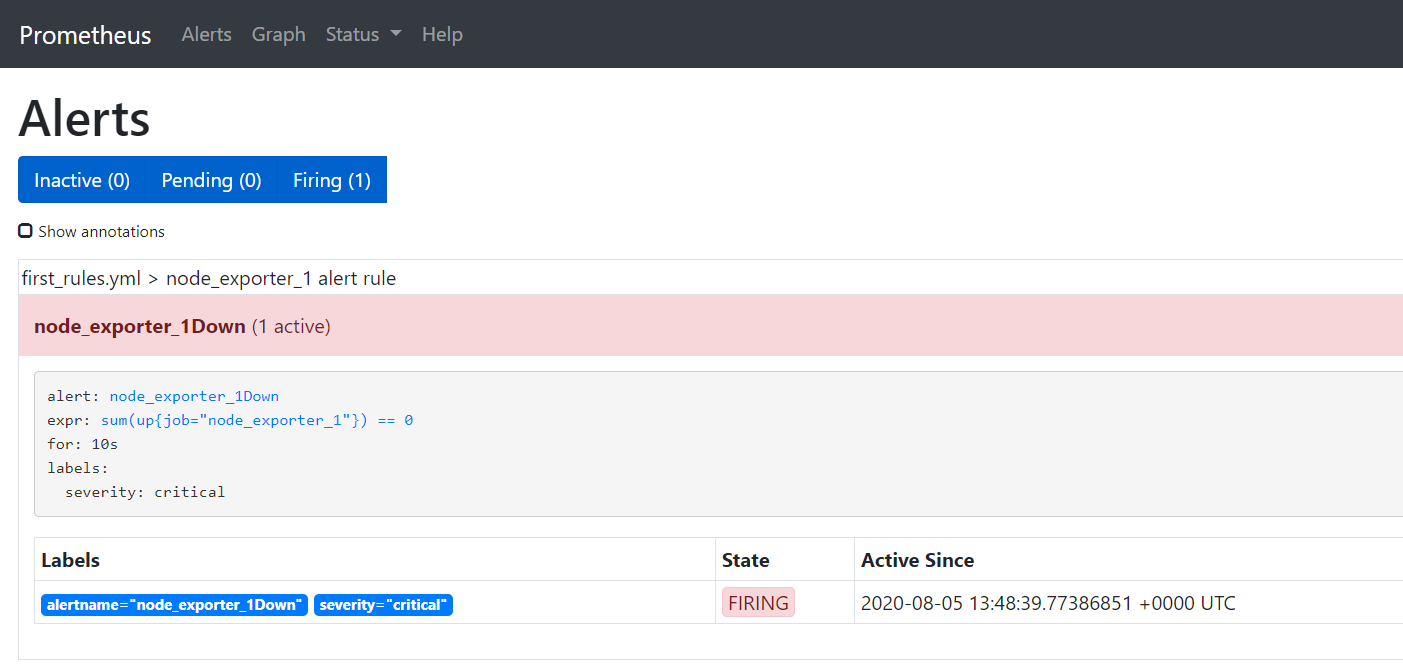
报警机制:
[root@192 src]# ll
总用量 142600
-rw-r--r--. 1 root root 25710888 8月   5 19:47 alertmanager-0.21.0.linux-amd64.tar.gz
-rw-r--r--. 1 root root 54991977 8月   5 20:58 grafana-5.4.2-1.x86_64.rpm
drwxr-xr-x. 2 3434 3434        6 8月   5 20:12 prometheus-2.20.0.linux-amd64
-rw-r--r--. 1 root root 65312139 8月   5 19:47 prometheus-2.20.0.linux-amd64.tar.gz
[root@192 src]# tar zxf alertmanager-0.21.0.linux-amd64.tar.gz
[root@192 src]# mkdir /usr/local/alertmanager
[root@192 src]# mv alertmanager-0.21.0.linux-amd64/* /usr/local/alertmanager/
[root@192 src]# cd /usr/local/alertmanager/
[root@192 alertmanager]# ll
总用量 51644
-rwxr-xr-x. 1 3434 3434 28871879 6月  17 16:54 alertmanager
-rw-r--r--. 1 3434 3434      380 6月  17 17:34 alertmanager.yml
-rwxr-xr-x. 1 3434 3434 23987848 6月  17 16:55 amtool
-rw-r--r--. 1 3434 3434    11357 6月  17 17:34 LICENSE
-rw-r--r--. 1 3434 3434      457 6月  17 17:34 NOTICE
[root@192 alertmanager]# vim alertmanager.yml
[root@192 alertmanager]# vim alertmanager.yml
[root@192 alertmanager]# ./alertmanager
[root@192 alertmanager]# cat alertmanager.yml
global:
  resolve_timeout: 5m
  smtp_smarthost: 'smtp.qq.com:465'
  smtp_from: 'QQ号@qq.com'
  smtp_auth_username: 'QQ号@qq.com'
  smtp_auth_password: '验证码'

route:
  group_by: ['alertname']
  group_wait: 10s
  group_interval: 10s
  repeat_interval: 10s
  receiver: 'mail-receiver'
receivers:
- name: 'mail-receiver'
  email_configs:
  - to: 'QQ号@qq.com'
inhibit_rules:
  - source_match:
      severity: 'critical'
    target_match:
      severity: 'warning'
    equal: ['alertname', 'dev', 'instance']

可以调整报警规则,来进行检测,收到邮箱就为成功!!!

 浙公网安备 33010602011771号