R语言|ggplot2| 绘制KEGG气泡图
在 RStudio 中使用 BiocManager 安装包
install.packages("BiocManager")
install.packages("ggplot2")
安装对应版本的 Rtools
安装完成后,使用命令安装 KEGGREST 以及所需要的相关包
BiocManager::install("KEGGREST")
BiocManager::install("fmcsR")
~~devtools::install_git("https://github.com/cran/RbioRXN.git")~~
包加载
library(KEGGREST)
~~library(RbioRXN)~~
查看KEGG数据库包含的数据
listDatabases()
获取单个数据集中的数据
pathway<- keggList("pathway")
head(pathway)
对单个数据库进行组织的选择
org <-keggList("pathway","hsa")
head(org)
如下图所示:
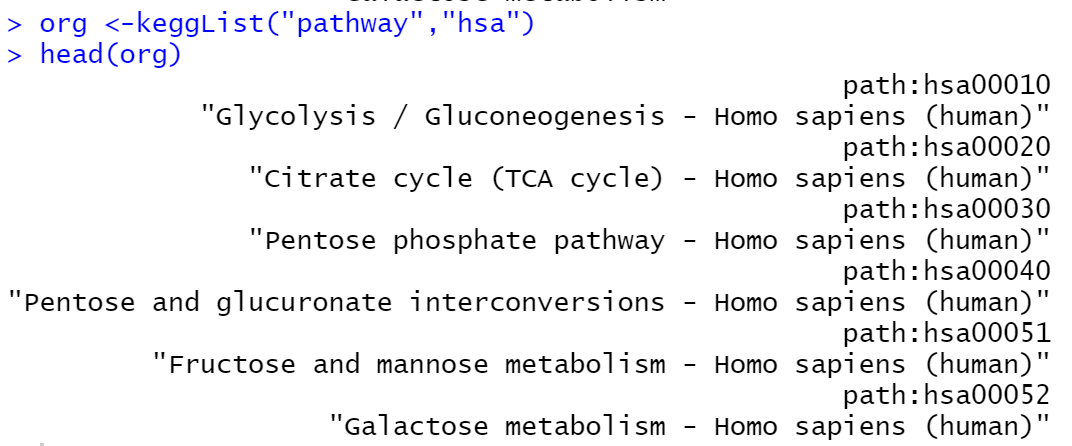
从上面可以看出keggList不仅可以提取单个数据集还可以获取对应物种的信息。在这里我们发现同样的通路编码ID却不一样,map+num泛指KEGG中的所有通路;has+num指的是人类物种的通路信息。
获取所有的代谢反应和化合物数据
keggAll = get.kegg.all()
save(keggAll,file="C:/data/metabolism/database/KEGG/keggAll.Rdata")
提取数据
reaction=keggAll$reaction
write.csv(reaction," reaction.csv")
compound=keggAll$compound
write.csv(compound," compound.csv")
至此我们就可以将KEGG中的数据提取到本地进行接下来的分析处理。
提取方法参考
数据提取参考
绘制气泡图
https://www.cnblogs.com/weizwz/p/15510373.html
本博客所有文章除特别声明外,均采用 「CC BY-NC-SA 4.0 DEED」 国际许可协议,转载请注明出处!
内容粗浅,如有错误,欢迎大佬批评指正

 浙公网安备 33010602011771号