
在Echarts 柱形图的单击事件中写入自定义的参数
标签:
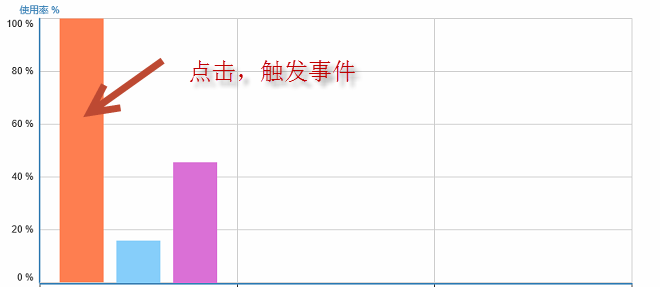
逻辑:(点击柱形图的某个实例(注意:三个柱子表示的是一个实例))
参考链接:http://echarts.baidu.com/doc/example/event.html
  {
                    name: ‘cunchu‘,
                    type: ‘bar‘,
                    data: [],
                    rawdate: []  //添加了rawdate参数(自定义的)
                },
 function eConsole(param) {
            var cloudid;
            var mes = ‘【‘ + param.type + ‘】‘;
            if (typeof param.seriesIndex != ‘undefined‘) {
                mes += ‘  seriesIndex : ‘ + param.seriesIndex;
                mes += ‘  dataIndex : ‘ + param.dataIndex;
                //alert(option.series[param.dataIndex].rawdate);
                cloudid = option.series[param.seriesIndex].rawdate[param.dataIndex];
                Tiaozhuan(cloudid);
            }
            if (param.type == ‘hover‘) {
                document.getElementById(‘hover-console‘).innerHTML = ‘Event Console : ‘ + mes;
            } else {
                document.getElementById(‘console‘).innerHTML = mes;
            }
            console.log(param);
        }
将你的自定义的参数,弄成数组,传值给rawdate,然后,可以通过option ,在根据下标,就可以获取自定义的参数:
option.series[param.seriesIndex].rawdate[param.dataIndex]
