疫情相关论文五篇(1)
 疫情相关论文五篇(1)
- Crowding and the shape of COVID-19 epidemics
- Differential effects of intervention timing on COVID-19 spread in the United States
- Mobility network models of COVID-19 explain inequities and inform reopening
- COVID-19 outbreak response, a dataset to assess mobility changes in Italy following national lockdown
- Local lockdowns outperform global lockdown on the far side of the COVID-19 epidemic curve ⭐⭐⭐
Crowding and the shape of COVID-19 epidemics
拥挤和COVID-19流行病的形态
原文链接: https://www.nature.com/articles/s41591-020-1104-0
代码、数据链接:https://github.com/Emergent-Epidemics/COVID_crowding 通过百度迁徙提取每日的人类移动测量,以估计中国各县每日移动的比例
Abstract
The coronavirus disease 2019 (COVID-19) pandemic is straining public health systems worldwide, and major non-pharmaceutical interventions have been implemented to slow its spread1,2,3,4. During the initial phase of the outbreak, dissemination of severe acute respiratory syndrome coronavirus 2 (SARS-CoV-2) was primarily determined by human mobility from Wuhan, China5,6. Yet empirical evidence on the effect of key geographic factors on local epidemic transmission is lacking7. In this study, we analyzed highly resolved spatial variables in cities, together with case count data, to investigate the role of climate, urbanization and variation in interventions. We show that the degree to which cases of COVID-19 are compressed into a short period of time (peakedness of the epidemic) is strongly shaped by population aggregation and heterogeneity, such that epidemics in crowded cities are more spread over time, and crowded cities have larger total attack rates than less populated cities. Observed differences in the peakedness of epidemics are consistent with a meta-population model of COVID-19 that explicitly accounts for spatial hierarchies. We paired our estimates with globally comprehensive data on human mobility and predict that crowded cities worldwide could experience more prolonged epidemics.
2019冠状病毒病(COVID-19)大流行正在给全球公共卫生系统带来压力,已实施了重大非药物干预措施,以减缓其传播。在疫情初期,严重急性呼吸综合征冠状病毒2 (SARS-CoV-2)的传播主要是由来自中国武汉的人员流动决定的。然而,缺乏关键地理因素对当地疫情传播影响的经验证据7。在本研究中,我们分析了高分辨率的城市空间变量,并结合案例计数数据,以探讨气候、城市化和变化在干预中的作用。我们显示的程度COVID-19病例被压缩成一个短的时间内(流行的巅峰)强烈的人口聚集和异质性,这种流行病在拥挤的城市更传播随着时间的推移,和拥挤的城市有较大的总攻击率比人口较少的城市。观察到的流行病顶峰的差异与COVID-19的元种群模型一致,该模型明确解释了空间层次。我们将我们的估计与全球范围内关于人类流动性的全面数据进行了对比,并预测,世界各地拥挤的城市可能会经历更长时间的流行病。(有道)
Differential effects of intervention timing on COVID-19 spread in the United States
干预时机对COVID-19在美国传播的不同影响
原文链接: https://www.science.org/doi/10.1126/sciadv.abd6370
Abstract
Assessing the effects of early nonpharmaceutical interventions on coronavirus disease 2019 (COVID-19) spread is crucial for understanding and planning future control measures to combat the pandemic. We use observations of reported infections and deaths, human mobility data, and a metapopulation transmission model to quantify changes in disease transmission rates in U.S. counties from 15 March to 3 May 2020. We find that marked, asynchronous reductions of the basic reproductive number occurred throughout the United States in association with social distancing and other control measures. Counterfactual simulations indicate that, had these same measures been implemented 1 to 2 weeks earlier, substantial cases and deaths could have been averted and that delayed responses to future increased incidence will facilitate a stronger rebound of infections and death. Our findings underscore the importance of early intervention and aggressive control in combatting the COVID-19 pandemic.
评估早期非药物干预措施对2019冠状病毒病(COVID-19)传播的影响,对于理解和规划未来防治大流行的控制措施至关重要。我们使用对报告的感染和死亡的观察、人类移动数据和一个异种群传播模型来量化2020年3月15日至5月3日期间美国各县疾病传播率的变化。我们发现,由于社会距离和其他控制措施,美国各地都出现了显著的、异步的基本生殖数量减少。反事实模拟表明,如果早1至2周实施这些同样的措施,就可以避免大量病例和死亡,而对未来发病率增加的延迟反应将促进感染和死亡的更强烈反弹。我们的研究结果强调了早期干预和积极控制在抗击COVID-19大流行中的重要性。
Data
We used the 2011–2015 5-Year American Commuting Survey (ACS) Commuting Flows data from the U.S. census survey to prescribe the intercounty movement in the transmission model before 15 March 2020 before broad control measures were announced. The county-to-county commuting data are publicly available from the U.S. Census Bureau www.census.gov/data/tables/2015/demo/metro-micro/commuting-flows-2015.html. We visualize the intercounty commuting in fig. S1. After 15 March, the census survey data are no longer representative due to changes of mobility behavior in response to control measures. Therefore, after 15 March 2020, we use estimates of the reduction of intercounty visitors to POI (e.g., restaurants, stores, etc.) to inform the decline of intercounty movement on a county-by-county basis www.safegraph.com/. For instance, if the number of intercounty visitors was reduced by 30% in a county on a given day relative to baseline estimates on 15 March 2020, then the size of subpopulations traveling to this county would be reduced by 30% accordingly. These real-time mobility data are available between 1 March 2020 and 7 June 2020. For dates beyond 7 June 2020, we maintained the last known level of intercounty movement.
County-level daily confirmed cases and deaths were compiled by USAFacts https://usafacts.org/visualizations/coronavirus-covid-19-spread-map/. Daily cases and deaths in the six metropolitan areas are shown in fig. S1.
Mobility network models of COVID-19 explain inequities and inform reopening
COVID-19的移动网络模型解释了不平等,并为重新开放提供了信息
Abstract
The coronavirus disease 2019 (COVID-19) pandemic markedly changed human mobility patterns, necessitating epidemiological models that can capture the effects of these changes in mobility on the spread of severe acute respiratory syndrome coronavirus 2 (SARS-CoV-2)1. Here we introduce a metapopulation susceptible–exposed–infectious–removed (SEIR) model that integrates fine-grained, dynamic mobility networks to simulate the spread of SARS-CoV-2 in ten of the largest US metropolitan areas. Our mobility networks are derived from mobile phone data and map the hourly movements of 98 million people from neighbourhoods (or census block groups) to points of interest such as restaurants and religious establishments, connecting 56,945 census block groups to 552,758 points of interest with 5.4 billion hourly edges. We show that by integrating these networks, a relatively simple SEIR model can accurately fit the real case trajectory, despite substantial changes in the behaviour of the population over time. Our model predicts that a small minority of ‘superspreader’ points of interest account for a large majority of the infections, and that restricting the maximum occupancy at each point of interest is more effective than uniformly reducing mobility. Our model also correctly predicts higher infection rates among disadvantaged racial and socioeconomic group solely as the result of differences in mobility: we find that disadvantaged groups have not been able to reduce their mobility as sharply, and that the points of interest that they visit are more crowded and are therefore associated with higher risk. By capturing who is infected at which locations, our model supports detailed analyses that can inform more-effective and equitable policy responses to COVID-19.
摘要
2019冠状病毒病(COVID-19)大流行显著改变了人类的移动模式,需要建立能够捕捉这些移动变化对严重急性呼吸综合征冠状病毒2 (SARS-CoV-2)传播的影响的流行病学模型。
在这里,我们引入了一个元人群易感暴露-感染消除(SEIR)模型,该模型集成了细粒度的动态移动网络,以模拟SARS-CoV-2在美国10个最大的大都市地区的传播。
我们移动网络是来自手机数据和地图的每小时运动9800万人社区(或普查块组)的兴趣点,如餐馆和宗教机构,连接56945年人口普查块团体感兴趣的552758点54亿小时边缘。
我们表明,通过整合这些网络,一个相对简单的SEIR模型可以准确地拟合真实情况的轨迹,尽管随着时间的推移,人口的行为发生了重大变化。
我们的模型预测,一小部分“超级传播者”感兴趣点导致了绝大多数感染,限制每个感兴趣点的最大占用比统一减少流动性更有效。
我们的模型还正确地预测了仅由于流动性差异导致的弱势种族和社会经济群体中较高的感染率
我们发现,弱势群体没有能够大幅减少他们的流动性,他们访问的兴趣点更拥挤,因此与更高的风险相关。
通过捕获哪些地点的感染者,我们的模型支持进行详细分析,为更有效和公平地应对COVID-19政策提供信息。
Data availability
Inferred hourly mobility networks as well as the estimated models are available at the project website (http://covid-mobility.stanford.edu). Raw census data (https://www.census.gov/programs-surveys/acs), case and death counts from The New York Times (https://github.com/nytimes/covid-19-data) and Google mobility data (https://www.google.com/covid19/mobility/) are also publicly available. Mobile phone mobility data are freely available to researchers, non-profit organizations and governments through the SafeGraph COVID-19 Data Consortium (https://www.safegraph.com/covid-19-data-consortium).
Code availability
Code is publicly available at the project website (http://covid-mobility.stanford.edu).
COVID-19 outbreak response, a dataset to assess mobility changes in Italy following national lockdown
COVID-19疫情应对数据集,用于评估意大利在国家封锁后的流动性变化
原文链接: https://www.nature.com/articles/s41597-020-00575-2#Sec1
Abstract
Italy has been severely affected by the COVID-19 pandemic, reporting the highest death toll in Europe as of April 2020. Following the identification of the first infections, on February 21, 2020, national authorities have put in place an increasing number of restrictions aimed at containing the outbreak and delaying the epidemic peak. On March 12, the government imposed a national lockdown. To aid the evaluation of the impact of interventions, we present daily time-series of three different aggregated mobility metrics: the origin-destination movements between Italian provinces, the radius of gyration, and the average degree of a spatial proximity network. All metrics were computed by processing a large-scale dataset of anonymously shared positions of about 170,000 de-identified smartphone users before and during the outbreak, at the sub-national scale. This dataset can help to monitor the impact of the lockdown on the epidemic trajectory and inform future public health decision making.
意大利受到新冠疫情的严重影响,截至2020年4月,意大利的死亡人数是欧洲最高的。在2020年2月21日发现首批感染病例后,国家当局采取了越来越多的限制措施,以遏制疫情爆发和推迟疫情高峰。3月12日,政府宣布全国封锁。为了帮助评估干预措施的影响,我们提出了三个不同的聚集移动指标的每日时间序列:意大利各省之间的出发地-目的地移动、旋转半径和空间邻近网络的平均程度。所有指标都是通过处理一个大规模数据集来计算的,该数据集在疫情爆发前和爆发期间匿名共享约17万名智能手机用户的位置,分布在次国家级范围内。该数据集有助于监测封锁对疫情发展轨迹的影响,并为未来的公共卫生决策提供信息。
旋转半径
\({r}_{g}=\frac{1}{L}\sqrt{\mathop{\sum }\limits_{i=1}^{L}{({{\bf{r}}}_{{\bf{i}}}-{{\bf{r}}}_{{\bf{cm}}})}^{2}}\)
where L is the full set of stops made by a user over a given time frame, ri is the vector of coordinates of stop i and rcm is the vector of coordinates of the center of mass, weighted by the duration of each stop Δti.
We compute the radius of gyration for each user on a weekly basis, so that L in Eq. 1 represents the set of stops made by a user during a week. We then compute descriptive statistics of the distribution of the radius of gyration by users’ home province.
空间邻近网络的平均程度
The average contact rate, or the number of unique contacts made by a person on a typical day is a fundamental quantity to model and understand infectious disease dynamics. We evaluated the effect of NPIs on the proximity of our users’ sample, by defining a proxy of the potential encounters each anonymous user could have in one hour. To this aim, we built a proximity network among users based on the locations they visited and the hour of the day when these visits occurred.
平均接触率,或一个人在典型一天内唯一接触的数量,是建模和理解传染病动力学的基本数量。我们通过定义每个匿名用户在一小时内可能遇到的潜在对象的代理,来评估npi对用户样本接近度的影响。为了达到这个目的,我们根据用户访问的地点和访问发生的时间在用户之间建立了一个邻近网络。
Code availability
All data records were generated using code developed in Python 316. The code is available upon request from the corresponding author. 要去找通讯作者拿😅
Local lockdowns outperform global lockdown on the far side of the COVID-19 epidemic curve ⭐⭐⭐
在COVID-19疫情曲线的后期,地方封锁的效果优于全球封锁
原文链接 : https://www.pnas.org/content/117/39/24575
Abstract
In the late stages of an epidemic, infections are often sporadic and geographically distributed. Spatially structured stochastic models can capture these important features of disease dynamics, thereby allowing a broader exploration of interventions. Here we develop a stochastic model of severe acute respiratory syndrome coronavirus 2 (SARS-CoV-2) transmission among an interconnected group of population centers representing counties, municipalities, and districts (collectively, “counties”). The model is parameterized with demographic, epidemiological, testing, and travel data from Ontario, Canada. We explore the effects of different control strategies after the epidemic curve has been flattened. We compare a local strategy of reopening (and reclosing, as needed) schools and workplaces county by county, according to triggers for county-specific infection prevalence, to a global strategy of province-wide reopening and reclosing, according to triggers for province-wide infection prevalence. For trigger levels that result in the same number of COVID-19 cases between the two strategies, the local strategy causes significantly fewer person-days of closure, even under high intercounty travel scenarios. However, both cases and person-days lost to closure rise when county triggers are not coordinated and when testing rates vary among counties. Finally, we show that local strategies can also do better in the early epidemic stage, but only if testing rates are high and the trigger prevalence is low. Our results suggest that pandemic planning for the far side of the COVID-19 epidemic curve should consider local strategies for reopening and reclosing.
在流行病的后期阶段,感染往往是零星的和地理上分布的。
空间结构随机模型可以捕捉疾病动态的这些重要特征,从而允许对干预措施进行更广泛的探索。
在这里,我们开发了一个严重急性呼吸综合征冠状病毒2 (SARS-CoV-2)在代表县、市和区(统称为“县”)的相互关联的人口中心群体之间传播的随机模型。
该模型采用来自加拿大安大略省的人口、流行病学、检测和旅行数据进行参数化。
我们探讨了疫情曲线变平后不同控制策略的效果。
我们根据特定县感染流行的触发因素,将一个县一个县重新开放(并根据需要重新关闭)学校和工作场所的当地策略与根据全省感染流行的触发因素,一个全省重新开放和重新关闭学校和工作场所的全球策略进行比较。
对于两种策略中导致相同COVID-19病例数量的触发水平,地方策略导致的关闭人日显著减少,即使在跨县旅行较多的情况下。
然而,当县的触发因素不协调,且检测率在县之间不同时,病例和因关闭而损失的人日都会增加。
最后,我们表明,只有在检测率高且触发流行率低的情况下,地方战略也可以在流行早期阶段取得更好的效果。
我们的结果表明,针对COVID-19疫情曲线远端的大流行规划应考虑重新开放和重新关闭的当地策略。
Model Overview
We model a population distributed across local population centers (“counties”) connected through travel. Within each county, transmission follows a SEPAIR disease natural history: S is susceptible to infection, E is infected, but not yet infectious (or, simply, “exposed”), P is presymptomatic infectiousness (or, simply, “presymptomatic”), A is infectious without ever developing symptoms (or, simply, “asymptomatic”), I is both infectious and symptomatic (or, simply, “symptomatic”), and R is removed (no longer infectious). Symptomatic individuals are tested for SARS-CoV-2, and their status becomes ascertained with some probability per day. The infection transmission probability in a county depends on the number of contacts in schools and workplaces—which are reduced by closures—and on contacts in other settings not affected by closures, such as homes. Transmission also depends on how effectively closures reduce transmission, and the extent to which population size drives transmission. The population behavioral response to the presence of COVID-19 is an important feature of physical distancing (28⇓⇓⇓–32). Hence, we assumed that transmission outside of schools and workplaces is reduced by individual physical distancing efforts (restricting social contacts, washing hands, etc.) and that more confirmed positive cases in the county cause more individuals to practice physical distancing. Each individual travels from their home county to another county for the day with some probability (Fig. 1B) that is reduced if schools and workplaces are closed in the destination county. Additional details on model structure, data sources, parameter values, and calibration appear in Materials and Methods.
我们对分布在当地人口中心(“县”)的人口进行建模,这些人口中心通过旅行联系在一起。
在每个县,传播遵循一种SEPAIR疾病的自然史:
S是容易受到感染,E是感染,但尚未感染(或简称为“暴露”),P是传染性发生前症状(或者简单,”发生前症状”),A是传染性没有出现症状(或简称为“无症状”)I是感染和症状(或简称为“症状”),和R是不再具有感染性。
对有症状的个人进行SARS-CoV-2检测,每天都有一定的可能性确定他们的状态。
一个县的感染传播概率取决于学校和工作场所的接触者数量(关闭会减少接触者数量)以及其他未受关闭影响的环境中的接触者数量,如家庭。
传播还取决于关闭措施如何有效地减少传播,以及人口规模在多大程度上驱动传播。
人群对COVID-19的行为反应是身体距离的一个重要特征(28⇓⇓⇓-32)。
因此,我们假设,通过个人保持身体距离(限制社交接触、洗手等),学校和工作场所以外的传播会减少,而且该县确诊的阳性病例越多,就会导致更多的人保持身体距离。每个人每天从他们的家乡到另一个国家旅行,如果目的地国家的学校和工作场所关闭,这种可能性会降低(图1B)。
关于模型结构、数据源、参数值和校准的更多细节见《材料与方法》。参数定义、值及文献来源见SI附录表1。
System Dynamics
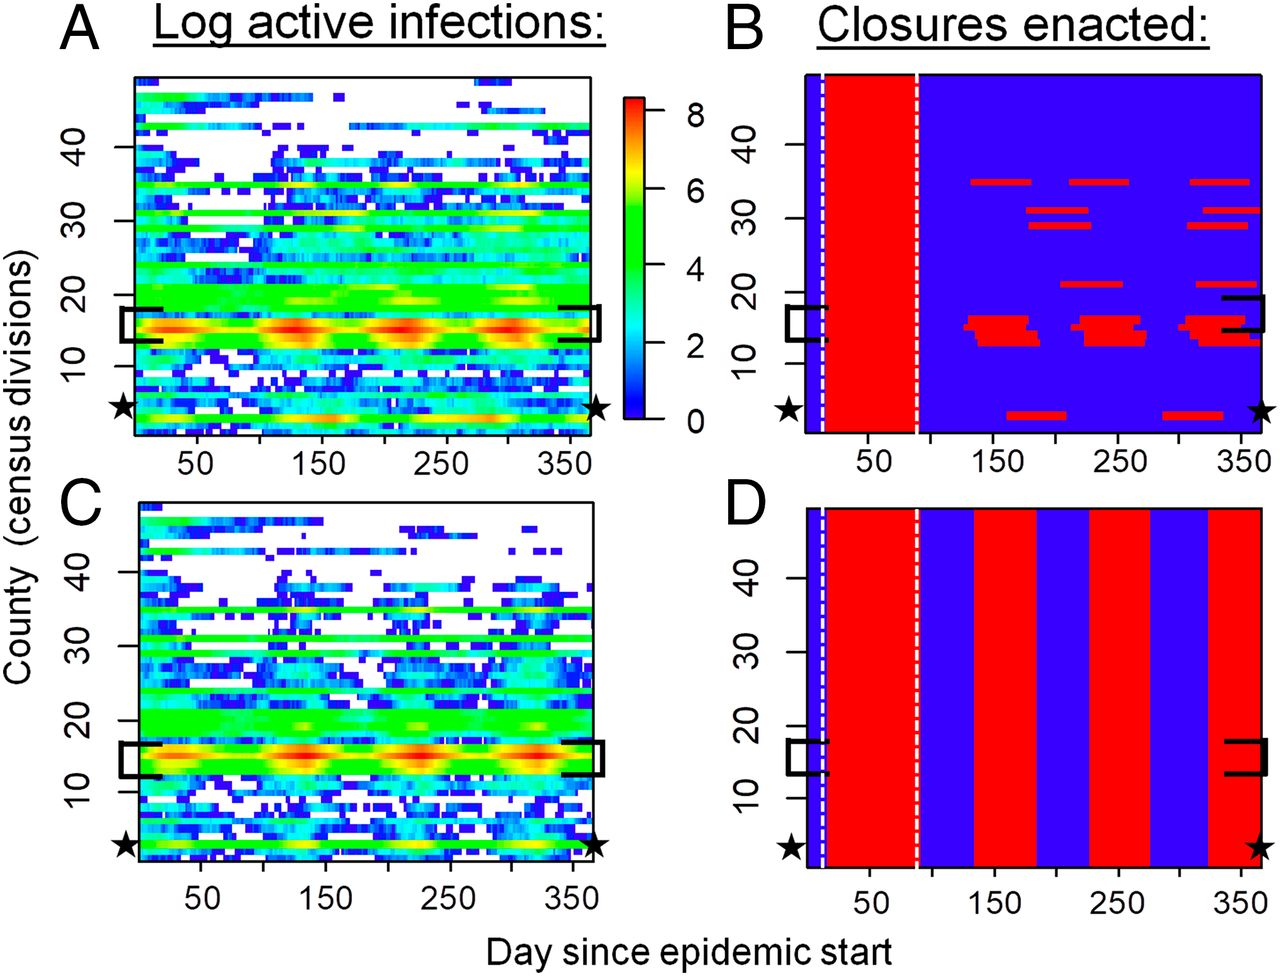
We ran reopening and reclosing simulations over a time horizon of 1 y and projected the number of cases in each county. To reflect COVID-19 mitigation in Ontario, each simulation began with a 75-d period of province-wide closure applied once 325 confirmed positive cases accumulated in the province. After this period, we contrasted a “local strategy” of reopening and reclosing counties individually, according to a trigger prevalence of confirmed positive COVID-19 cases in the county, to a “global strategy” of reopening and reclosing the entire province, according to a trigger prevalence of confirmed positive COVID-19 cases in the province. Our model dynamics are characterized by two distinct regimes (Fig. 2 A and C). In highly populated counties, COVID-19 is endemic throughout the time horizon of the simulation. However, in counties with lower populations, cases blink in and out during the year, as infections jump between counties through travel and decline due to testing and voluntary distancing alone. The infection patterns appear qualitatively similar under both strategies (Fig. 2 A and C), but closure patterns are very different, with most counties being closed most of the time under the global strategy (Fig. 2 B and D).
我们在1年的时间范围内进行了重新开放和重新关闭的模拟,并预测了每个县的病例数量。为了反映安大略省COVID-19缓解情况,每次模拟开始时,一旦该省积累了325例确诊阳性病例,就在全省范围内实施75天的关闭期。在这段时间之后,我们对比了重新开放和重新关闭县的“地方战略”,根据触发确认COVID-19阳性病例的流行县,重新开放的“全球战略”和重合闸整个省,根据触发患病率正COVID-19的确诊病例。我们的模型的动态特征是两种不同的制度(图2 A和C)。在人口密集的县,COVID-19在整个模拟时间范围内都是流行的。然而,在人口较少的县,病例在一年中出现和消失,因为感染通过旅行在县之间跳跃,并由于检测和自愿保持距离而下降。两种策略下的感染模式在定性上看起来相似(图2a和C),但封闭模式有很大不同,在全局策略下大多数国家在大部分时间是封闭的(图2b和D)。
Local versus Global Reopening Strategies.
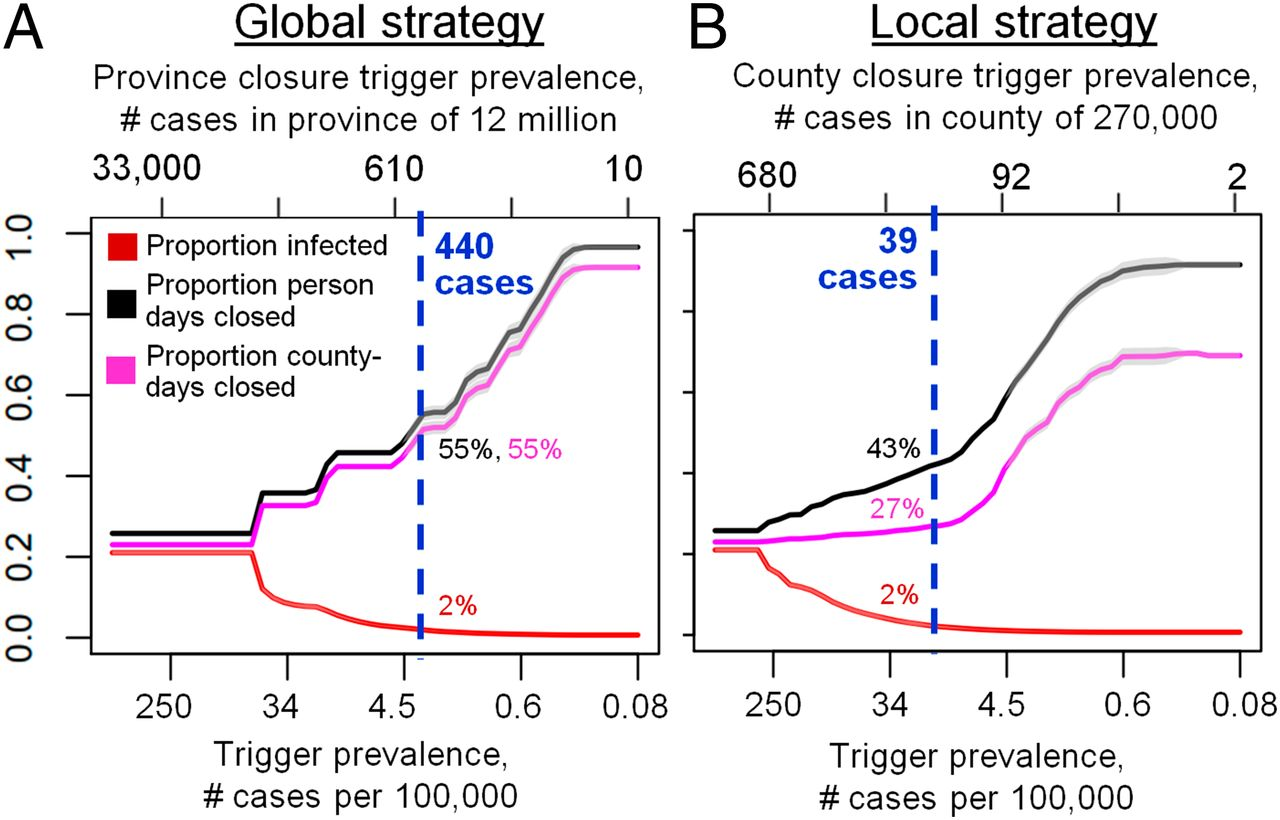
The local strategy tends to outperform the global strategy for most values of the trigger prevalence (Fig. 3). When the trigger prevalence is very high (i.e., an extreme scenario where decision makers reopen or reclose for a prevalence of 1,000 confirmed positive cases per 100,000), a high proportion of the population becomes infected, since school and workplace closures are rarely sustained in either strategy after the initial 75-d province closure. At the other extreme of the lowest trigger prevalence, both strategies minimize infections by maintaining closures for the majority of the year. However, intermediate values of the trigger prevalence represent a “sweet spot” for the local strategy, where it outperforms the global strategy in terms exhibiting significantly fewer person-days of closure for a comparable number of COVID-19 cases. The local strategy can accomplish this because it affords flexibility to enact closures only in areas with continuing active outbreaks—primarily, more populous counties with higher epidemic spread rates. Conversely, for the same trigger prevalence, cases of infection in this regime are always lower under the local strategy. We identify an optimal trigger prevalence as the trigger prevalence that allows significant reductions in person-days lost to closure, but only permits cases to increase by 1% compared to its minimum value across all values of the trigger prevalence (blue dashed lines, Fig. 3). At this optimal trigger, the local strategy results in 22% fewer person-days of closure across the entire province than the global strategy.
本地与全球重新开放战略。
本地策略往往比全球战略的最值触发患病率(图3)。当触发器患病率非常高(即,一个极端的情况决策者重开或再次接通1000确认阳性病例/ 100000)患病率,高比例的人口都会被感染,因为在最初的75天省份关闭之后,学校和工作场所关闭在这两种策略中都很少持续。在触发流行率最低的另一个极端,这两种战略都通过在一年的大部分时间内保持关闭来最大限度地减少感染。然而,触发流行率的中间值代表了本地策略的“最佳点”,在相同数量的COVID-19病例中,本地策略的关闭人日显著少于全球策略。地方战略可以做到这一点,因为它提供了灵活性,只在疫情持续活跃的地区颁布关闭措施——主要是人口更多、流行病传播率更高的县。相反,对于同样的触发流行,在当地战略下,这一制度的感染病例总是较低。我们确定了一个最佳触发流行率,即允许显著减少因关闭而损失的人日的触发流行率,但在所有触发流行率值中,与其最小值相比,只允许病例增加1%(蓝色虚线,图3)。在这个最佳触发时,与全球战略相比,地方战略使全省关闭的人日减少了22%。
Benefits of Coordination.
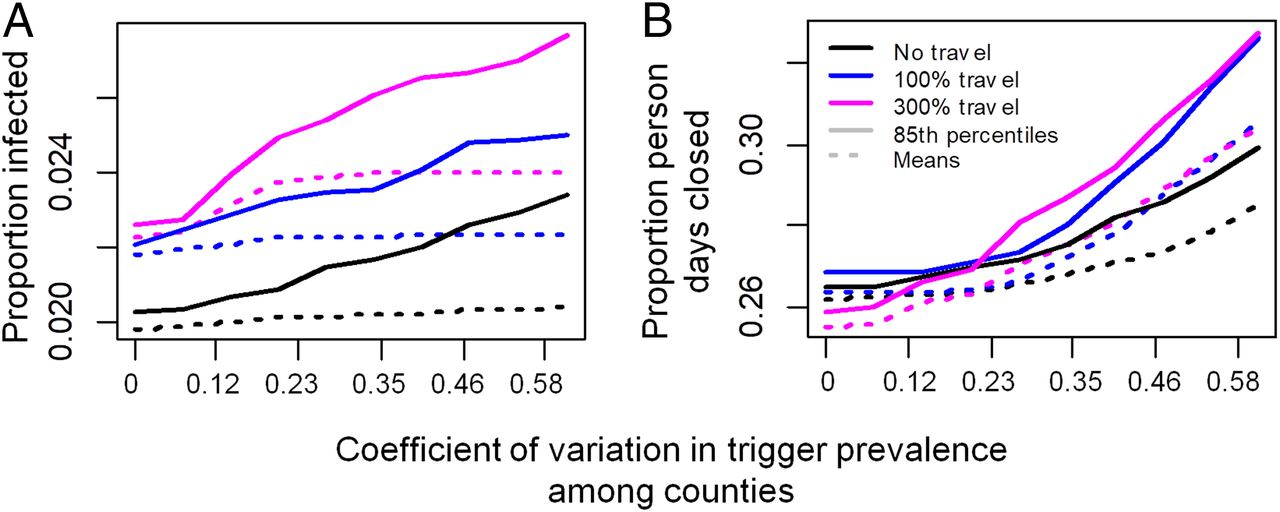
A local strategy could enable different counties to adopt different triggers. Our simulation results confirm that poor coordination can undermine the benefits of the local strategy (Fig. 4). As between-county variation in the trigger prevalence increases, both the mean and 85% quantile across stochastic realizations of both the proportion infected and person-days closed rise under a broad range of assumptions for intercounty travel rates (Fig. 4). The rise in infections in this scenario is somewhat counteracted by the rise in person-days lost to closure: Renewed outbreaks in counties that lift closures prematurely export infections to neighboring counties, which, in turn, necessitates additional closures in those counties and increases the number of person-days lost to closure (Fig. 4B). This emphasizes how close coordination can be beneficial from both public health and economic perspectives. Lack of coordination in testing is also problematic (SI Appendix, Fig. 1). As between-county variation in the testing rate for symptomatic individuals increases, the mean and 85% quantile of proportion infected and person-days lost to closure increase in most of the stochastic realizations.
协调的好处。
一个地方策略可以使不同的国家采取不同的触发器。我们的模拟结果证实,协调不良会破坏当地策略的好处(图4)。随着触发流行率在县与县之间的差异增加,在大范围的跨县旅行率假设下,感染比例和关闭人数日数的随机实现的平均值和85%分位数都上升了(图4)。在这种情况下,感染人数的上升在一定程度上被关闭人数日数的上升抵消了:过早取消关闭的县再次爆发疫情,将感染输出到邻近的县,这反过来需要这些县进一步关闭,并增加因关闭而损失的人日数(图4B)。这强调了密切的协调如何能从公共卫生和经济的角度获益。在检测中缺乏协调也是一个问题(SI附录,图1)。随着有症状个体的检测率在县与县之间的差异增加,在大多数随机实现中,平均和85%分位数的感染比例和因关闭而损失的人日增加。
Sensitivity Analysis.
These results are qualitatively unchanged under moderate changes to parameter values in univariate sensitivity analyses (SI Appendix, Fig. 2). Projections are most sensitive to variation in the transmission probability, efficacy of physical distancing, and the removal rate. The performance of the local versus global strategies depends relatively little on the extent to which transmission probabilities are driven by population size, in other words, how rapidly the probability that a given susceptible person is infected by a given infectious person declines with the population size of the county (ξ is changed and model is refitted with new ξ values; SI Appendix, Fig. 3). Similarly, the relative performance of the two strategies is not strongly affected by doubling of travel rates (SI Appendix, Fig. 4): Although cases and person-days lost to closure increase for both strategies, the local strategy retains its relative performance lead over the global strategy.
闭总人日。
Local Closures in the Early Epidemic.
We also compared a modified local strategy of omitting the initial 75-d province-wide closure and closing counties one at a time from the very beginning (followed by reopening and reclosing counties as needed) to our baseline local strategy of following a 75-d province-wide closure with reopening and reclosing counties one at a time. We found that the modified local strategy could outperform the baseline local strategy under specific conditions for trigger prevalence and testing rates (Fig. 5). In particular, the trigger prevalence must be reduced compared to our baseline analysis (Fig. 5A), such that counties are closed as soon as a few cases are detected (Fig. 5C). The optimal trigger prevalence for the modified local strategy increases exponentially with the testing probability (from 17 to 120 positive active cases in a city the size of Ottawa), meaning that counties can apply less stringent triggers only if their testing rates are very high and find more cases (Fig. 5C). Testing of asymptomatic individuals is not included in our baseline analysis, but might occur under high testing capacity and effective contact tracing, and would permit a higher trigger prevalence and reduced person-days closed under the modified local strategy (Fig. 5B), by limiting epidemic growth to the most populous counties. However, given the initial short supply of test kits and long testing turnaround times that characterized Ontario and many other jurisdictions, the testing rate for symptomatic individuals probably remained below the required 0.1/d during the early epidemic in Ontario. Sensitivity analysis in the early epidemic (Fig. 5B) additionally shows that the benefit of fewer person-days closed under the local strategy declines when closures begin after many thousands of people are already infected, when travel is high, or if initial infections are concentrated in cities. Taken together, these results suggest that the modified local strategy of omitting the 75-d province-wide closure could significantly outperform the baseline local strategy early in the initial epidemic only with prompt mitigation, moderate-to-high testing rates, and very low trigger prevalence (a scenario resembling the South Korean control strategy). This finding reiterates public health consensus that early and aggressive action in the early stages of a pandemic, and also potentially during second waves, could minimize both infections and total person-days of closure.
敏感性分析。
在单变量敏感性分析中,这些结果在参数值中度变化的情况下是定性不变的(SI附录,图2)。预测对传输概率、物理距离的有效性和去除率的变化最为敏感。
局部策略和全局策略的表现相对而言,取决于传播概率由种群大小驱动的程度相对较小,换句话说,
一个给定的易感者被一个给定的感染者感染的概率随该县的人口规模下降的速度有多快(ξ值改变,模型用新的ξ值重新拟合;
同样地,两种策略的相对绩效也不受差旅费率加倍的影响(SI附录,图4):尽管两种策略的案例和因关闭而损失的人日都有所增加,但本地策略的相对绩效仍然领先于全球策略。
疫情早期的地方关闭。
相比我们还修改本地的省略初始战略75 - d全省范围的关闭和关闭县一次从一开始(其次是根据需要重新开放和重合闸县)我们的基线当地战略75 - d全省范围关闭后重新开放和重合闸县一次。
我们发现修改本地策略可能比基线本地策略在特定条件下触发患病率和检查率(图5),特别是触发器必须降低患病率相比我们的基线分析(图5),这样县尽快关闭几例检测到(图5)。
的最佳触发患病率修改本地策略增加指数与检测概率(从17到120年积极活跃的情况下在城市渥太华的大小),这意味着县少可以应用严格的触发器只有测试的利率非常高,找到更多的情况下(图5)。
我们的基线分析不包括对无症状个体的检测,但在高检测能力和有效的接触者追踪下可能会发生,并通过将疫情增长限制在人口最多的国家,从而允许更高的触发流行率和减少根据修订的地方战略关闭的人日(图5B)。
然而,鉴于安大略省和许多其他司法管辖区的特点是最初检测包供应不足,检测周转时间长,在安大略省早期流行期间,有症状个人的检测率可能仍低于规定的0.1/d。
疫情早期的敏感性分析(图5B)还表明,当数千人已经感染、旅行量高或最初感染集中在城市时,开始关闭时,根据地方战略关闭较少的人日的效益就会下降。
综上所述,这些结果表明,仅在迅速缓解、中高检测率、
触发流行率非常低(类似于韩国的控制策略)。
这一发现重申了公共卫生共识,即在大流行早期阶段以及可能在第二波期间及早采取积极行动,可最大限度地减少感染和关
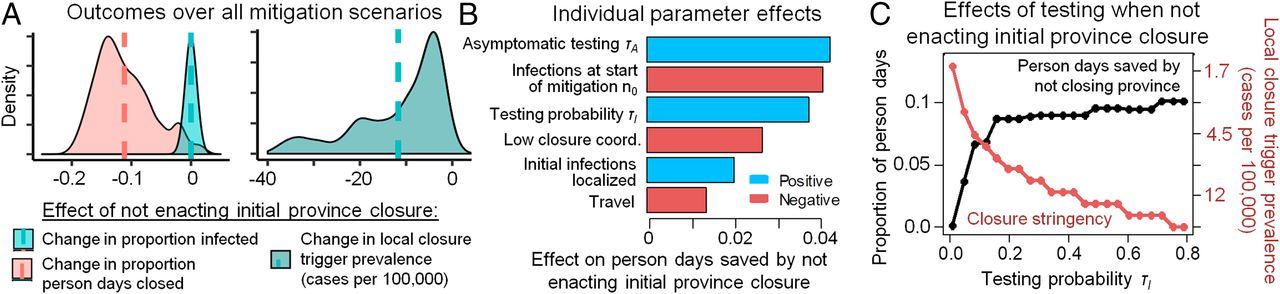
在中高检测率和低触发流行率的情况下,从一开始就逐个县采取关闭措施,并在疫情开始时省略最初的全省75天关闭措施,可以最大限度地减少感染和关闭人日。(A)在所有控制参数组合中(B中具体说明),在疫情开始时不实施最初的75天省份封锁减少了关闭的人日,但要求在县级关闭决定中降低触发流行率(竖线表示平均数)。(B)敏感性分析各控制参数对省略最初全省75天封闭避免的封闭人日的影响。(C)与全省75天的关闭相比,中等至高检测水平允许不那么严格的县关闭标准(触发流行率,红色),并导致更少的关闭人日(黑色)。计算了疫情开始后120天内的损失人日、感染人数和触发流行率。在整个分析中,我们使用基线τI=0.16。在A和B中,τI和n0的变化超过其基线值的±75%,低协调要么缺失,要么存在(在这种情况下,γl,j在国家之间具有均匀分布,变异系数为0.27),无症状检验τA=0或τA=τI/2=0.08,初始感染要么在人口中均匀分布,要么集中在两个随机选择的人口为50万的县。

 浙公网安备 33010602011771号