zendstudio xdebug 配置
1. 下载XDebug: http://www.xdebug.org/download.php 通过phpinfo()查看你的php版本,现在相对应的dll文件

2. 找到php.ini
再最后边 加入 XDebug 配置:
zend_extension="D:\php\ext\php_xdebug-2.1.0-5.3-vc6.dll"
xdebug.auto_trace = On
;是否开启异常跟踪
xdebug.show_exception_trace = On
;是否开启远程调试自动启动
xdebug.remote_autostart = Off
;是否开启远程调试
xdebug.remote_enable = On
;允许调试的客户端IP
xdebug.remote_host=127.0.0.1
;远程调试的端口(默认9000)
;xdebug.remote_port=9000
;调试插件dbgp
xdebug.remote_handler=dbgp
;是否收集变量
xdebug.collect_vars = On
;是否收集返回值
xdebug.collect_return = On
;是否收集参数
xdebug.collect_params = On
;跟踪输出路径
xdebug.trace_output_dir="e:/temp/xdebug"
;是否开启调试内容
xdebug.profiler_enable=On
;调试输出路径
xdebug.profiler_output_dir="e:/temp/xdebug"
然后保存。注意:保存完后,要将php.ini 拷贝一份覆盖c:\windows\下的php.ini
5. 重启 Apache
6、查看phpinfo(),你会看到里边有xdebug的信息
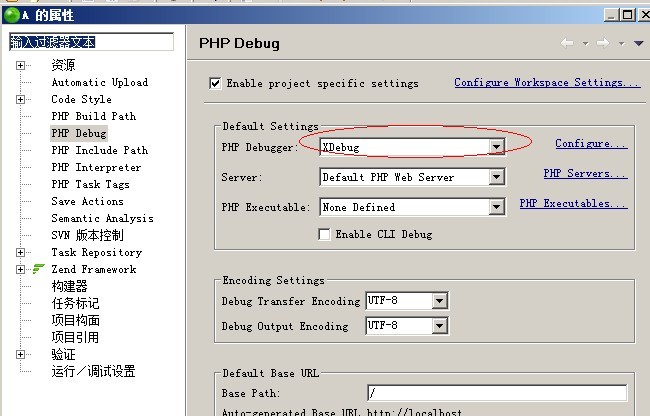
7、zend studio配置
首选项中的Debug配置为XDebug(同项目配置)
同时 项目-》属性配置Xdebug
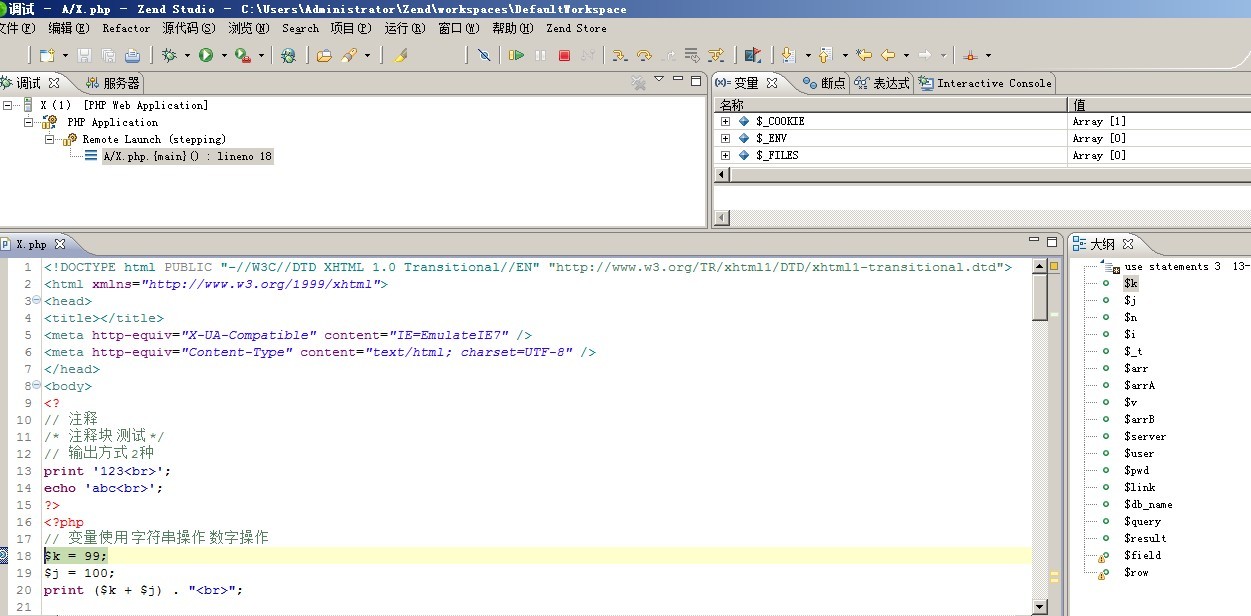
5.接下来可以运行项目进行调试了
Debug Configurations可通过三种方式进入:1、右击需要调试的PHP文件,选择Debug As或者打开调试的PHP文件;2、选择菜单栏上Run菜单下的Debug As进入;3、点击菜单栏Run菜单下方小蜘蛛图标旁的向下箭头选择Debug Configurations。

 浙公网安备 33010602011771号