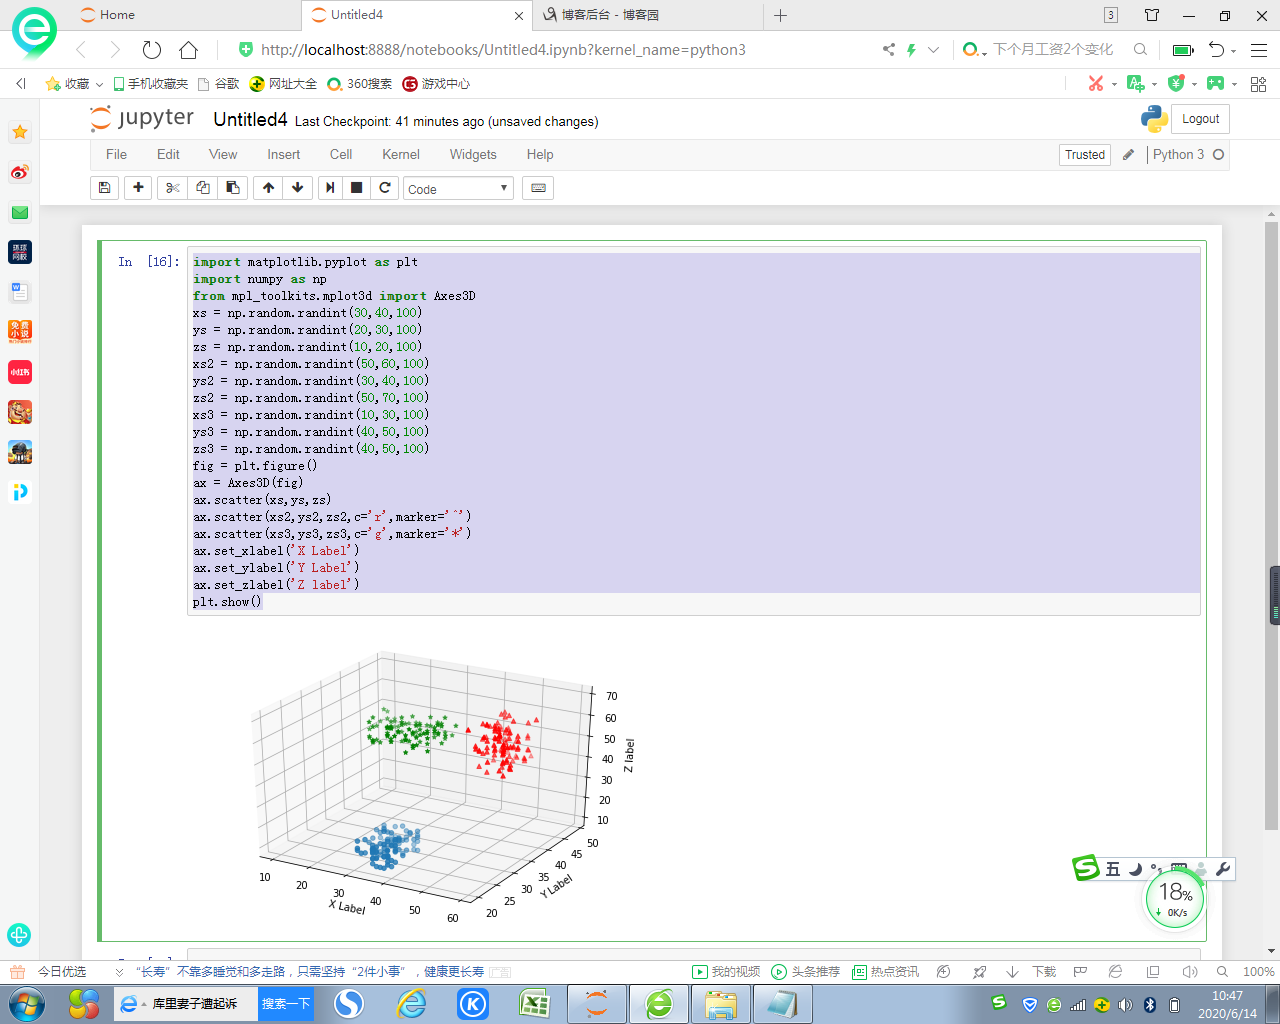
3D散点图
import matplotlib.pyplot as plt
import numpy as np
from mpl_toolkits.mplot3d import Axes3D
xs = np.random.randint(30,40,100)
ys = np.random.randint(20,30,100)
zs = np.random.randint(10,20,100)
xs2 = np.random.randint(50,60,100)
ys2 = np.random.randint(30,40,100)
zs2 = np.random.randint(50,70,100)
xs3 = np.random.randint(10,30,100)
ys3 = np.random.randint(40,50,100)
zs3 = np.random.randint(40,50,100)
fig = plt.figure()
ax = Axes3D(fig)
ax.scatter(xs,ys,zs)
ax.scatter(xs2,ys2,zs2,c='r',marker='^')
ax.scatter(xs3,ys3,zs3,c='g',marker='*')
ax.set_xlabel('X Label')
ax.set_ylabel('Y Label')
ax.set_zlabel('Z label')
plt.show()

 浙公网安备 33010602011771号