

python疫情爬虫
一、选题的背景
- 2019年12月以来,湖北省武汉市持续开展流感及相关疾病监测,发现多起病毒性肺炎病例,均诊断为病毒性肺炎/肺部感染。
- 2020年1月20日,国家主席对新型冠状病毒感染的肺炎疫情作出重要指示,强调要把人民群众生命安全和身体健康放在第一位,坚决遏制疫情蔓延势头。
- 我们也因当时刻关注疫情发展,希望疫情也能尽快结束。
- 我选择爬取国内实时疫情对现在疫情进行分析。
二、主题式网络爬虫设计方案
1.主题式网络爬虫名称:新冠疫情数据;
2.主题式网络爬虫爬取的内容与数据特征分析:腾讯新闻实时分析;
3.网络爬虫设计方案概述:从网页源代码中找出数据对应标签,对数据进行分析和可视化处理。
三、主题页面的结构特征分析
1.
- Htmls 页面解析:F12;
- 节点(标签)查找方法与遍历方法:在所需数据位置右键→查找,即可找到标签;
三、网络爬虫程序设计
1.数据爬取与采集
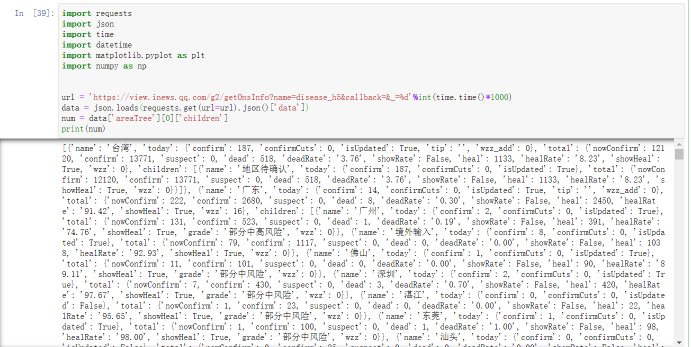
import requests

import json

import time

import datetime

import matplotlib.pyplot as plt

import numpy as np


url = 'https://view.inews.qq.com/g2/getOnsInfo?name=disease_h5&callback=&_=%d'%int(time.time()*1000)

data = json.loads(requests.get(url=url).json()['data'])

num = data['areaTree'][0]['children']

print(num)
- 对数据进行清洗和处理
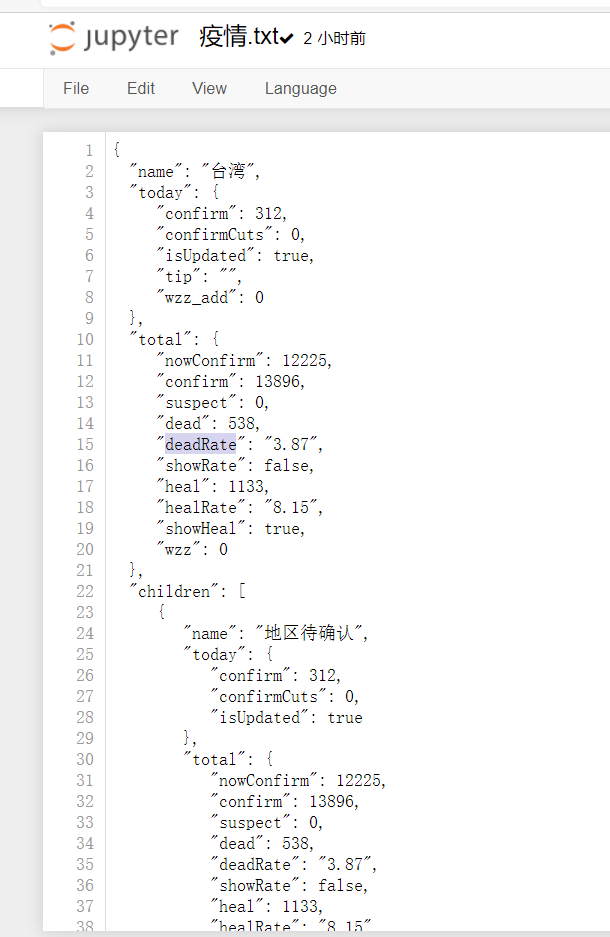
生成文本:
分析数据:
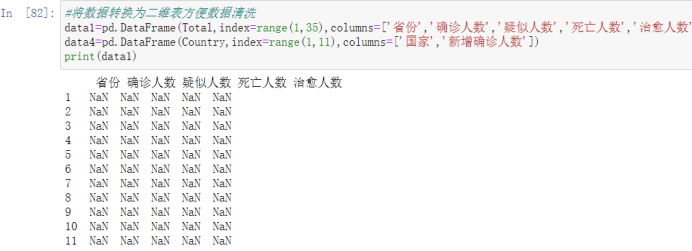
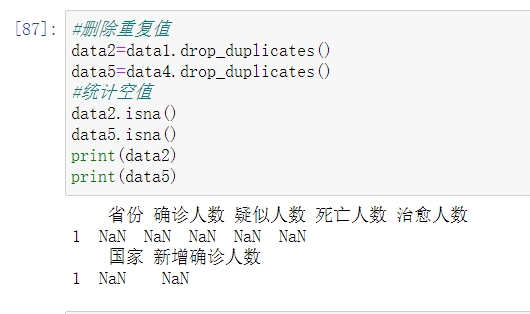
对数据进行清洗
查看缺失值

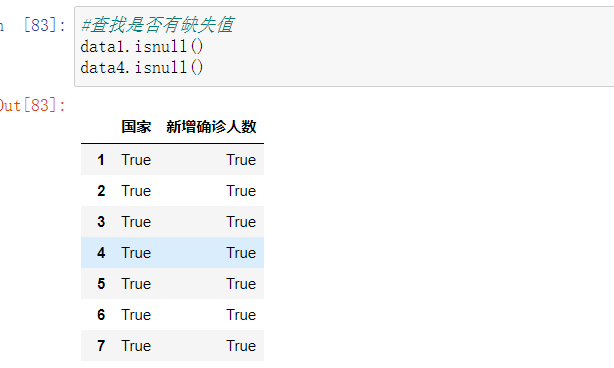
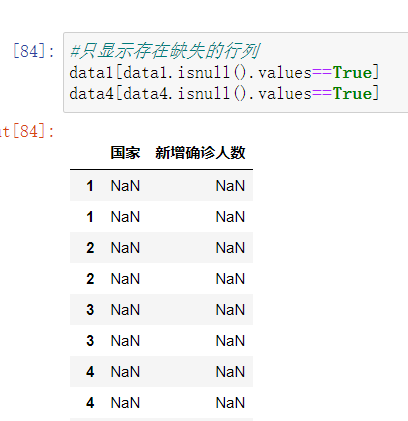
显示缺失行列
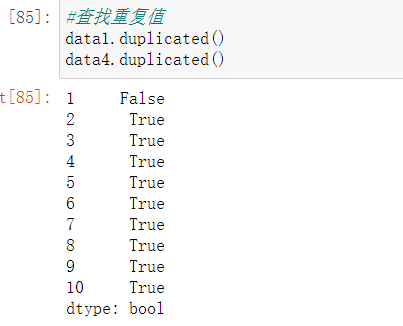
查找重复值
删除、统计
4.数据分析与可视化
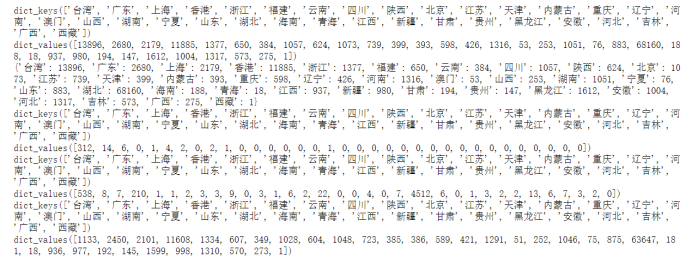
# 解析确诊数据

total_data = {}

for item in num:

    if item['name'] not in total_data:

        total_data.update({item['name']:0})

    for city_data in item['children']:

        total_data[item['name']] +=int(city_data['total']['confirm'])


# 解析疑似数据

total_suspect_data = {}

for item in num:

    if item['name'] not in total_suspect_data:

        total_suspect_data.update({item['name']:0})

    for city_data in item['children']:

        total_suspect_data[item['name']] +=int(city_data['total']['suspect'])


# 解析死亡数据

total_dead_data = {}

for item in num:

    if item['name'] not in total_dead_data:

        total_dead_data.update({item['name']:0})

    for city_data in item['children']:

        total_dead_data[item['name']] +=int(city_data['total']['dead'])


# 解析治愈数据

total_heal_data = {}

for item in num:

    if item['name'] not in total_heal_data:

        total_heal_data.update({item['name']:0})

    for city_data in item['children']:

        total_heal_data[item['name']] +=int(city_data['total']['heal'])


# 解析新增确诊数据

total_new_data = {}

for item in num:

    if item['name'] not in total_new_data:

        total_new_data.update({item['name']:0})

    for city_data in item['children']:

        total_new_data[item['name']] +=int(city_data['today']['confirm'])


#统计数据并输出

names = list(total_data.keys())

num1 = list(total_data.values())

num2 = list(total_suspect_data.values())

num3 = list(total_dead_data.values())

num4 = list(total_heal_data.values())

num5 = list(total_new_data.values())


today=datetime.date.today()

f=open('./疫情-%s.csv'%(today),'w',encoding='utf-8')

f.write('省份,确诊人数,死亡人数,治愈人数,新增确诊\n')

i = 0

while i<len(names):

    f.write(names[i]+','+str(num1[i])+','+str(num3[i])+','+str(num4[i])+','+str(num5[i])+'\n')

    i = i + 1
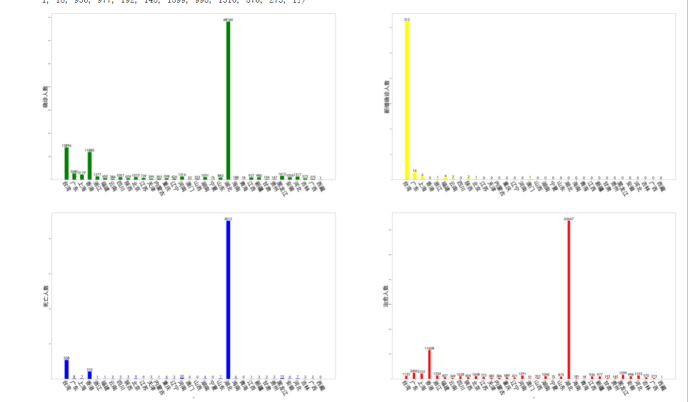
#绘制柱形图


plt.figure(figsize=[100,60])

plt.rcParams['font.sans-serif'] = ['SimHei']

plt.rcParams['axes.unicode_minus'] = False


#绘制确诊数据

p1 = plt.subplot(221)

names = total_data.keys()

nums = total_data.values()

print(names)

print(nums)

print(total_data)

plt.bar(names, nums, width=0.5, color='green')

plt.ylabel("确诊人数", rotation=90,size=50)

plt.xticks(list(names), rotation=-60, size=50)

for a, b in zip(list(names), list(nums)):

    plt.text(a, b, b, ha='center', va='bottom', size=35)

plt.sca(p1)


#绘制新增确诊数据

p2 = plt.subplot(222)

names = total_new_data.keys()

nums = total_new_data.values()

print(names)

print(nums)

plt.bar(names, nums, width=0.5, color='yellow')

plt.ylabel("新增确诊人数", rotation=90,size=50)

plt.xticks(list(names), rotation=-60, size=50)

for a, b in zip(list(names), list(nums)):

    plt.text(a, b, b, ha='center', va='bottom', size=35)

plt.sca(p2)


#绘制死亡数据

p3 = plt.subplot(223)

names = total_dead_data.keys()

nums = total_dead_data.values()

print(names)

print(nums)

plt.bar(names, nums, width=0.5, color='blue')

plt.xlabel("地区")

plt.ylabel("死亡人数", rotation=90,size=50)

plt.xticks(list(names), rotation=-60, size=50)

for a, b in zip(list(names), list(nums)):

    plt.text(a, b, b, ha='center', va='bottom', size=35)

plt.sca(p3)


#绘制治愈数据

p4 = plt.subplot(224)

names = total_heal_data.keys()

nums = total_heal_data.values()

print(names)

print(nums)

plt.bar(names, nums, width=0.3, color='red')

plt.xlabel("地区")

plt.ylabel("治愈人数", rotation=90,size=50)

plt.xticks(list(names), rotation=-60, size=50)

for a, b in zip(list(names), list(nums)):

    plt.text(a, b, b, ha='center', va='bottom', size=35)

plt.sca(p4)

plt.show()
汇总代码
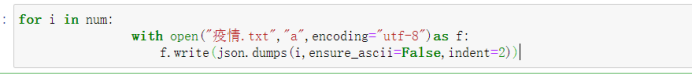
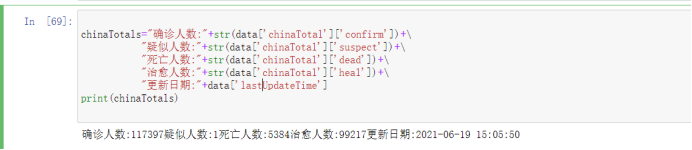
import requests

import json

import time

import datetime

import matplotlib.pyplot as plt

import numpy as np


url = 'https://view.inews.qq.com/g2/getOnsInfo?name=disease_h5&callback=&_=%d'%int(time.time()*1000)

data = json.loads(requests.get(url=url).json()['data'])

num = data['areaTree'][0]['children']

print(num)


for i in num:

                with open("疫情.txt","a",encoding="utf-8")as f:

                    f.write(json.dumps(i,ensure_ascii=False,indent=2))


chinaTotals="确诊人数:"+str(data['chinaTotal']['confirm'])+\

           "疑似人数:"+str(data['chinaTotal']['suspect'])+\

           "死亡人数:"+str(data['chinaTotal']['dead'])+\

           "治愈人数:"+str(data['chinaTotal']['heal'])+\

           "更新日期:"+data['lastUpdateTime']

print(chinaTotals)


#将数据转换为二维表方便数据清洗

data1=pd.DataFrame(Total,index=range(1,35),columns=['省份','确诊人数','疑似人数','死亡人数','治愈人数'])

data4=pd.DataFrame(Country,index=range(1,11),columns=['国家','新增确诊人数'])

print(data1)

#查找是否有缺失值

data1.isnull()

data4.isnull()

#只显示存在缺失的行列

data1[data1.isnull().values==True]

data4[data4.isnull().values==True]

#查找重复值

data1.duplicated()

data4.duplicated()

#删除重复值

data2=data1.drop_duplicates()

data5=data4.drop_duplicates()

#统计空值

data2.isna()

data5.isna()

print(data2)

print(data5)


# 解析确诊数据

total_data = {}

for item in num:

    if item['name'] not in total_data:

        total_data.update({item['name']:0})

    for city_data in item['children']:

        total_data[item['name']] +=int(city_data['total']['confirm'])


# 解析疑似数据

total_suspect_data = {}

for item in num:

    if item['name'] not in total_suspect_data:

        total_suspect_data.update({item['name']:0})

    for city_data in item['children']:

        total_suspect_data[item['name']] +=int(city_data['total']['suspect'])


# 解析死亡数据

total_dead_data = {}

for item in num:

    if item['name'] not in total_dead_data:

        total_dead_data.update({item['name']:0})

    for city_data in item['children']:

        total_dead_data[item['name']] +=int(city_data['total']['dead'])


# 解析治愈数据

total_heal_data = {}

for item in num:

    if item['name'] not in total_heal_data:

        total_heal_data.update({item['name']:0})

    for city_data in item['children']:

        total_heal_data[item['name']] +=int(city_data['total']['heal'])


# 解析新增确诊数据

total_new_data = {}

for item in num:

    if item['name'] not in total_new_data:

        total_new_data.update({item['name']:0})

    for city_data in item['children']:

        total_new_data[item['name']] +=int(city_data['today']['confirm'])


#统计数据并输出

names = list(total_data.keys())

num1 = list(total_data.values())

num2 = list(total_suspect_data.values())

num3 = list(total_dead_data.values())

num4 = list(total_heal_data.values())

num5 = list(total_new_data.values())


today=datetime.date.today()

f=open('./疫情-%s.csv'%(today),'w',encoding='utf-8')

f.write('省份,确诊人数,死亡人数,治愈人数,新增确诊\n')

i = 0

while i<len(names):

    f.write(names[i]+','+str(num1[i])+','+str(num3[i])+','+str(num4[i])+','+str(num5[i])+'\n')

    i = i + 1


#绘制柱形图


plt.figure(figsize=[100,60])

plt.rcParams['font.sans-serif'] = ['SimHei']

plt.rcParams['axes.unicode_minus'] = False


#绘制确诊数据

p1 = plt.subplot(221)

names = total_data.keys()

nums = total_data.values()

print(names)

print(nums)

print(total_data)

plt.bar(names, nums, width=0.5, color='green')

plt.ylabel("确诊人数", rotation=90,size=50)

plt.xticks(list(names), rotation=-60, size=50)

for a, b in zip(list(names), list(nums)):

    plt.text(a, b, b, ha='center', va='bottom', size=35)

plt.sca(p1)


#绘制新增确诊数据

p2 = plt.subplot(222)

names = total_new_data.keys()

nums = total_new_data.values()

print(names)

print(nums)

plt.bar(names, nums, width=0.5, color='yellow')

plt.ylabel("新增确诊人数", rotation=90,size=50)

plt.xticks(list(names), rotation=-60, size=50)

for a, b in zip(list(names), list(nums)):

    plt.text(a, b, b, ha='center', va='bottom', size=35)

plt.sca(p2)


#绘制死亡数据

p3 = plt.subplot(223)

names = total_dead_data.keys()

nums = total_dead_data.values()

print(names)

print(nums)

plt.bar(names, nums, width=0.5, color='blue')

plt.xlabel("地区")

plt.ylabel("死亡人数", rotation=90,size=50)

plt.xticks(list(names), rotation=-60, size=50)

for a, b in zip(list(names), list(nums)):

    plt.text(a, b, b, ha='center', va='bottom', size=35)

plt.sca(p3)


#绘制治愈数据

p4 = plt.subplot(224)

names = total_heal_data.keys()

nums = total_heal_data.values()

print(names)

print(nums)

plt.bar(names, nums, width=0.3, color='red')

plt.xlabel("地区")

plt.ylabel("治愈人数", rotation=90,size=50)

plt.xticks(list(names), rotation=-60, size=50)

for a, b in zip(list(names), list(nums)):

    plt.text(a, b, b, ha='center', va='bottom', size=35)

plt.sca(p4)

plt.show()
五、总结
1.由数据可以看出确诊人数,死亡人数和治愈人数湖北均较高
台湾新增人数明显较高;
2.本次作业了解到自身短板过多,很多知识没有学习透彻,导致遇到在过程中遇到很多问题,并且不能完整的完成本次作业,之后得多复习学过的知识。

 浙公网安备 33010602011771号