2、安装Spark与Python练习 6.RDD综合练习:更丰富的操作
一、安装Spark
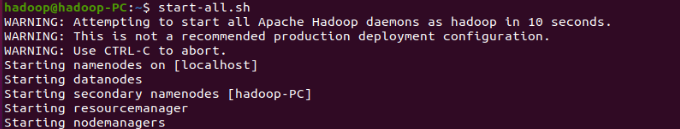
1、检查基础环境hadoop、jdk
2、下载Spark(略)
3、解压、文件夹重命名、权限(略)
4、配置文件


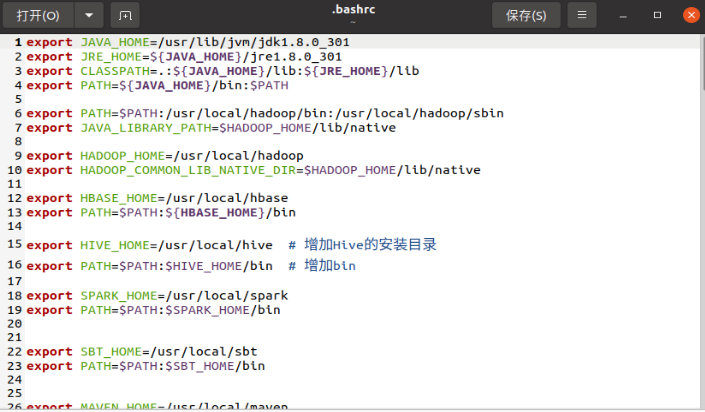
5、环境变量
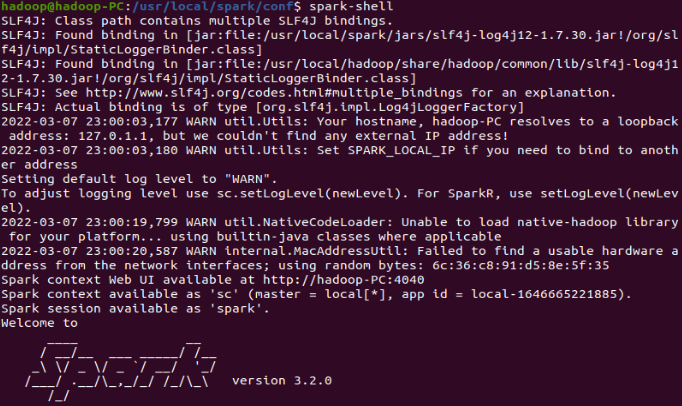
6、试运行Python代码

二、Python编程练习:英文文本的词频统计
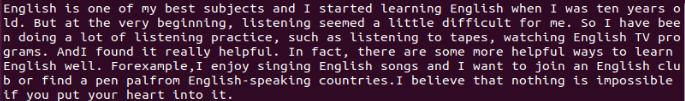
1、准备文本

2、编写代码


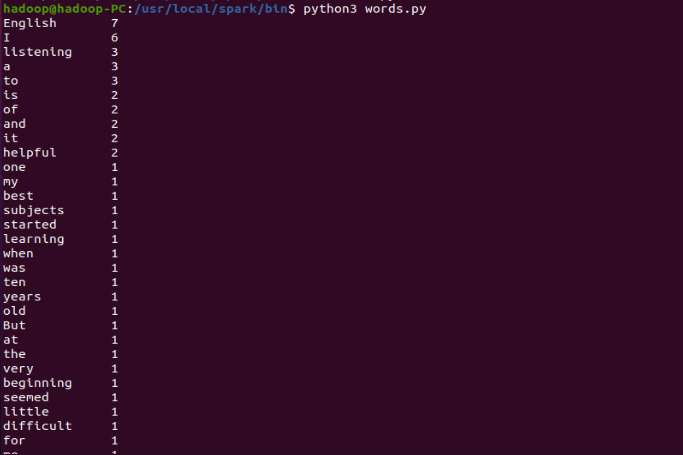
3、运行结果
6.RDD练习
集合运算练习
union(), intersection(),subtract(), cartesian()

内连接与外连接
join(), leftOuterJoin(), rightOuterJoin(), fullOuterJoin()
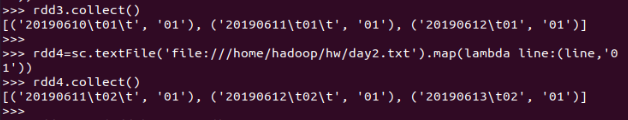
多个考勤文件,签到日期汇总,出勤次数统计
三、综合练习:学生课程分数
网盘下载sc.txt文件,通过RDD操作实现以下数据分析:
|
1
|
>>> scm=sc.textFile("file:///home/hadoop/hw/sc.txt").map(lambda line:line.split(',')).map(lambda line:[line[0],line[1],int(line[2])]) |

持久化 scm.cache()

总共有多少学生?map(), distinct(), count()

开设了多少门课程?

生成(姓名,课程分数)键值对RDD,观察keys(),values()
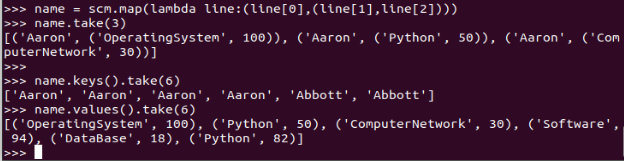
每个学生选修了多少门课?map(), countByKey()

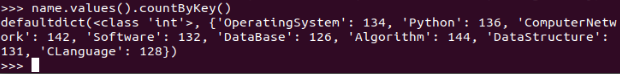
每门课程有多少个学生选?map(), countByValue()
有多少个100分?

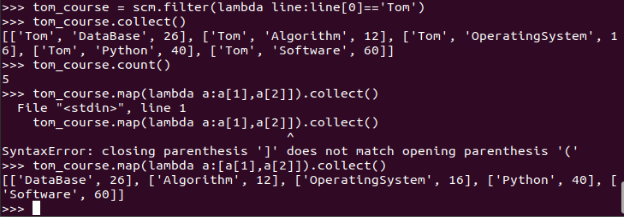
Tom选修了几门课?每门课多少分?filter(), map() RDD
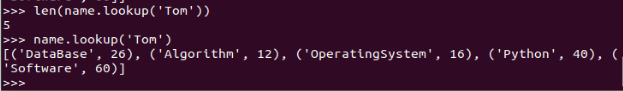
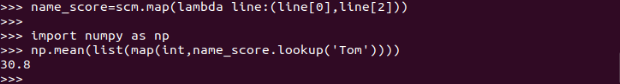
Tom选修了几门课?每门课多少分?map(),lookup() list
Tom的成绩按分数大小排序。filter(), map(), sortBy()

Tom的平均分。map(),lookup(),mean()

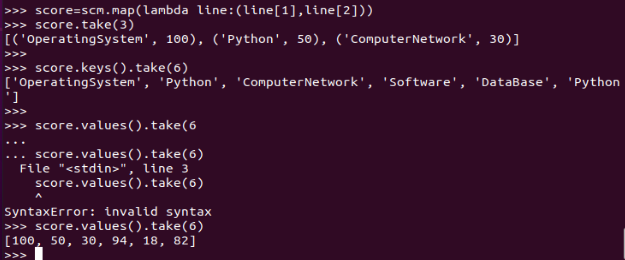
生成(课程,分数)RDD,观察keys(),values()
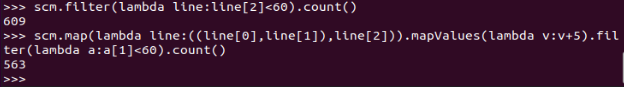
每个分数+5分。
mapValues(func)
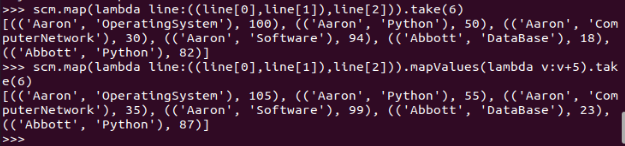
map(func)

查看不及格人数的变化
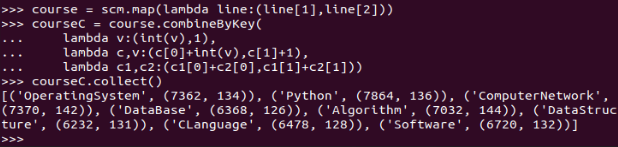
求每门课的选修人数及所有人的总分。combineByKey()
|
1
2
3
4
5
6
|
>>> course = scm.map(lambda line:(line[1],line[2]))>>> courseC = course.combineByKey( lambda v:(int(v),1), lambda c,v:(c[0]+int(v),c[1]+1), lambda c1,c2:(c1[0]+c2[0],c1[1]+c2[1]))>>> courseC.collect() |
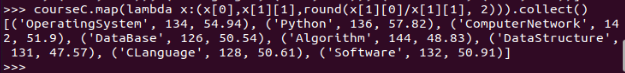
求每门课的选修人数及平均分,精确到2位小数。map(),round()
|
1
|
>>> courseC.map(lambda x:(x[0],x[1][1],round(x[1][0]/x[1][1], 2))).collect() |
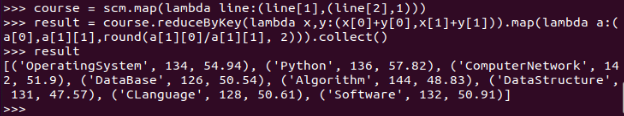
求每门课的选修人数及平均分。用reduceByKey()实现,并比较与combineByKey()的异同。
|
1
2
3
|
>>> course = scm.map(lambda line:(line[1],(line[2],1)))>>> result = course.reduceByKey(lambda x,y:(x[0]+y[0],x[1]+y[1])).map(lambda a:(a[0],a[1][1],round(a[1][0]/a[1][1], 2))).collect()>>> reuslt |
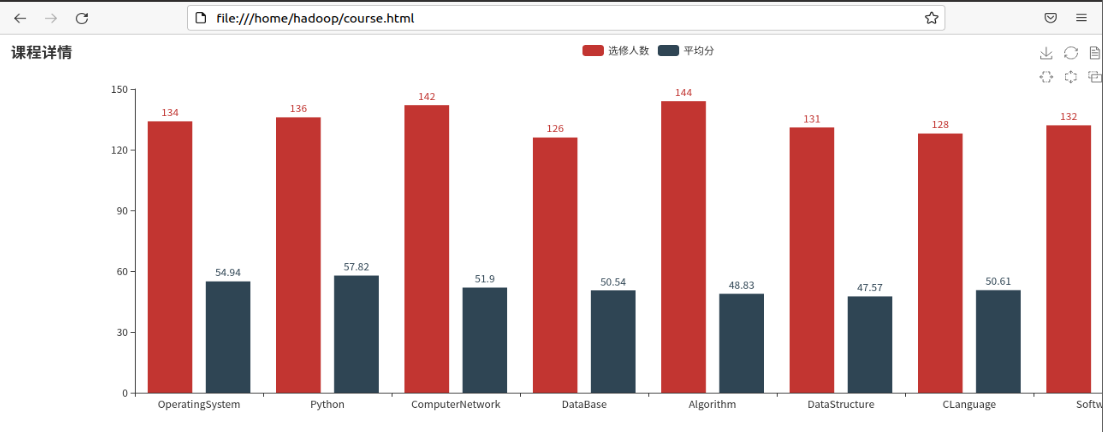
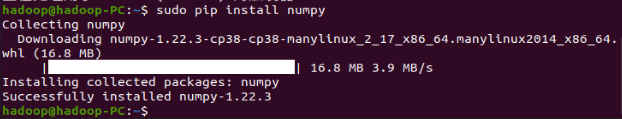
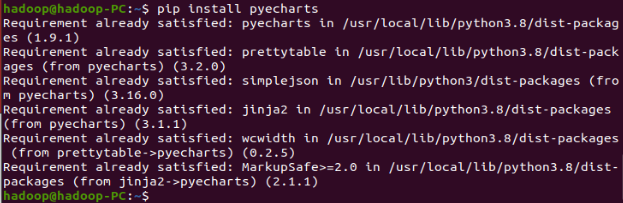
结果可视化。 pyecharts.charts,Bar()
前提:下载pyecharts库
|
1
2
3
4
5
6
7
8
9
10
11
12
13
14
15
16
17
18
|
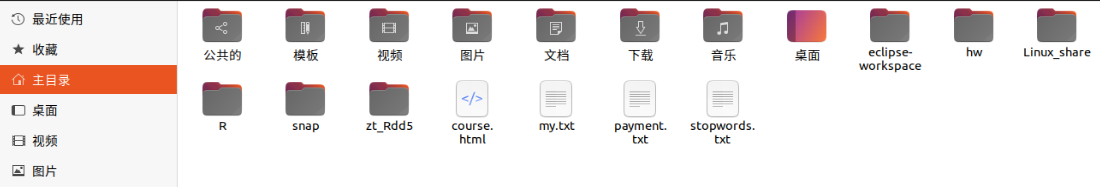
>>> course_name = [i[0] for i in result]>>> course_pnum = [i[1] for i in result]>>> course_mean = [i[2] for i in result]>>> from pyecharts.charts import Bar>>> from pyecharts import options as opts>>> bar = ( Bar(init_opts=opts.InitOpts(width="1500px")) .add_xaxis(course_name) .add_yaxis("选修人数", course_pnum) .add_yaxis("平均分", course_mean) .set_global_opts(title_opts=opts.TitleOpts(title="课程详情"), toolbox_opts=opts.ToolboxOpts(),xaxis_opts=opts.AxisOpts( axislabel_opts={"interval":"0"})))>>> bar.render('course.html') |
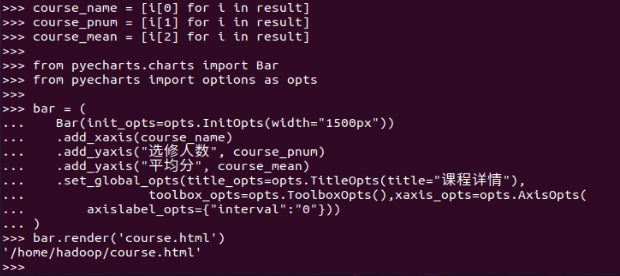
生成的.html会保存在/home/hadoop/course.html