
Prometheus+Grafana监控Mysql数据库
安装配置
Prometheus是Go语言编写的,所以仅依赖二进制编译库,从官网根据操作系统下载对应的二进制库:https://prometheus.io/download/
解压到/usr/local/prometheus目录下
tar -xzvf prometheus-2.45.2.linux-amd64.tar.gz
mv prometheus-2.45.2.linux-amd64 /usr/local/prometheus
其中prometheus.yml是其配置文件,其内容如下所示
# 全局配置
global:
  scrape_interval: 15s # 设置采集信息的间隔,默认一分钟
  evaluation_interval: 15s # 设置评估数据的间隔,默认一分钟
  # scrape_timeout 采集超时时间默认10s.

# 报警设置
alerting:
  alertmanagers:
    - static_configs:
        - targets:
          # - alertmanager:9093

# 规则文件,一次性加载后间隔固定时间会对监测数据进行评估
rule_files:
  # - "first_rules.yml"
  # - "second_rules.yml"

# 设置采集数据的来源
scrape_configs:
  # 定义采集任务的名字
  - job_name: "prometheus"

		# 定义数据来源,由于prometheus自己会在9090端口暴露自己的监测数据,因此可以通过如下路径采集自身监测数据
		# 默认采用http协议,数据路径参数metrics_path默认为'/metrics',因此可以从http://localhost:9090/metrics得到监测数据
    static_configs:
      - targets: ["localhost:9090"]
添加系统prometheus服务,在启动命令中指定配置文件和数据目录
vim /etc/systemd/system/prometheus.service

[Unit]
Description=Prometheus
Wants=network-online.target
After=network-online.target

[Service]
User=prometheus
Group=prometheus
Type=simple
ExecStart=/usr/local/bin/prometheus/prometheus \
    --config.file /usr/local/bin/prometheus/prometheus.yml \
    --storage.tsdb.path /usr/local/bin/prometheus/data

[Install]
WantedBy=multi-user.target
指定使用上述配置文件启动应用
# 添加用户
useradd --no-create-home --shell /bin/false prometheus
# 为用户赋予文件夹权限
chown -R prometheus:prometheus /usr/local/bin/prometheus

# 重新加载system服务
systemctl daemon-reload
# 设置开机启动
systemctl enable prometheus.service
# 启动
systemctl start prometheus
# 查看状态
systemctl status prometheus
通过http://localhost:9090端口可以看到prometheus的管理页面
Grafana
Grafana: https://grafana.com/
Grafana是一个跨平台的开源的度量分析和可视化工具,支持从多种数据源(如prometheus)获取数据进行可视化数据展示。
下载页面:https://grafana.com/grafana/download?pg=get&plcmt=selfmanaged-box1-cta1
CentOS可以通过yum命令直接安装
sudo yum install -y https://dl.grafana.com/enterprise/release/grafana-enterprise-10.2.3-1.x86_64.rpm
默认安装在/usr/share/grafana目录下
配置
配置文件在/etc/grafana/grafana.ini ,其中服务的协议、域名、端口的配置如下
#################################### Server ####################################
[server]
# Protocol (http, https, h2, socket)
protocol = http

# This is the minimum TLS version allowed. By default, this value is empty. Accepted values are: TLS1.2, TLS1.3. If nothing is set TLS1.2 would be taken
;min_tls_version = ""

# The ip address to bind to, empty will bind to all interfaces
;http_addr =

# The http port  to use
http_port = 3000

# The public facing domain name used to access grafana from a browser
domain = localhost

# Redirect to correct domain if host header does not match domain
# Prevents DNS rebinding attacks
;enforce_domain = false

# The full public facing url you use in browser, used for redirects and emails
# If you use reverse proxy and sub path specify full url (with sub path)
root_url = %(protocol)s://%(domain)s:%(http_port)s/
启动
通过如下命令启动Grafana
sudo systemctl daemon-reload
sudo systemctl start grafana-server
sudo systemctl status grafana-server
之后访问上面配置的3000端口就可以看到Grafana页面,第一次登陆默认用户名和密码都是admin
监控mysql
为mysql数据库创建一个exporter账户
# 切换到自带的权限管理数据库
use mysql;
# 创建work帐号,同时设置密码
CREATE USER 'exporter'@'%' IDENTIFIED BY 'Exporter1234!';
# 分配权限
grant SELECT,UPDATE,INSERT,DELETE on *.* To 'exporter'@'%';
# 刷新使配置生效
flush privileges;
从prometheus官网下载mysqld_exporter,之后解压并启动即可
wget https://github.com/prometheus/mysqld_exporter/releases/download/v0.15.1/mysqld_exporter-0.15.1.linux-amd64.tar.gz

tar xvzf mysqld_exporter-0.15.1.linux-amd64.tar.gz
mv mysqld_exporter-0.15.1.linux-amd64 /usr/local/bin/mysqld_exporter
在当前目录下编辑配置文件.my-exporter.cnf
[client]
user=exporter
password=Exporter1234!
host=localhost
port=3306
根据配置文件启动mysqld_exporter,并将数据暴露到9104端口,并且通过参数指定暴露的数据
./mysqld_exporter --web.listen-address=localhost:9104 --config.my-cnf=/usr/bin/mysqld_exporter/.my-exporter.cnf
也可以注册到系统服务,
vim /etc/systemd/system/mysqld_exporter.service

[Unit]
Description=mysqld_exporter
After=network.target
[Service]
Type=simple
User=mysqld_exporter
ExecStart=/usr/local/bin/mysqld_exporter/mysqld_exporter --config.my-cnf=/usr/local/bin/mysqld_exporter/.my-exporter.cnf
Restart=on-failure
[Install]
WantedBy=multi-user.target
以服务的方式进行启动管理
# 添加用户
useradd --no-create-home --shell /bin/false mysqld_exporter
# 为用户赋予文件夹权限
chown -R mysqld_exporter:mysqld_exporter /usr/local/bin/mysqld_exporter

# 重新加载系统配置
systemctl daemon-reload
# 开机启动
systemctl enable mysqld_exporter.service
# 启动服务
systemctl start mysqld_exporter
# 查看状态
systemctl status mysqld_exporter
看到mysqld_exporter启动成功,默认在9104端口,通过http://localhost:9104/metrics可以看到采集到的数据
修改prometheus配置文件信息并重启prometheus
scrape_configs:
  # 添加作业并命名
  - job_name: 'mysql'
    # 静态添加node
    static_configs:
    # 指定监控端
    - targets: ['47.98.138.176:9104']
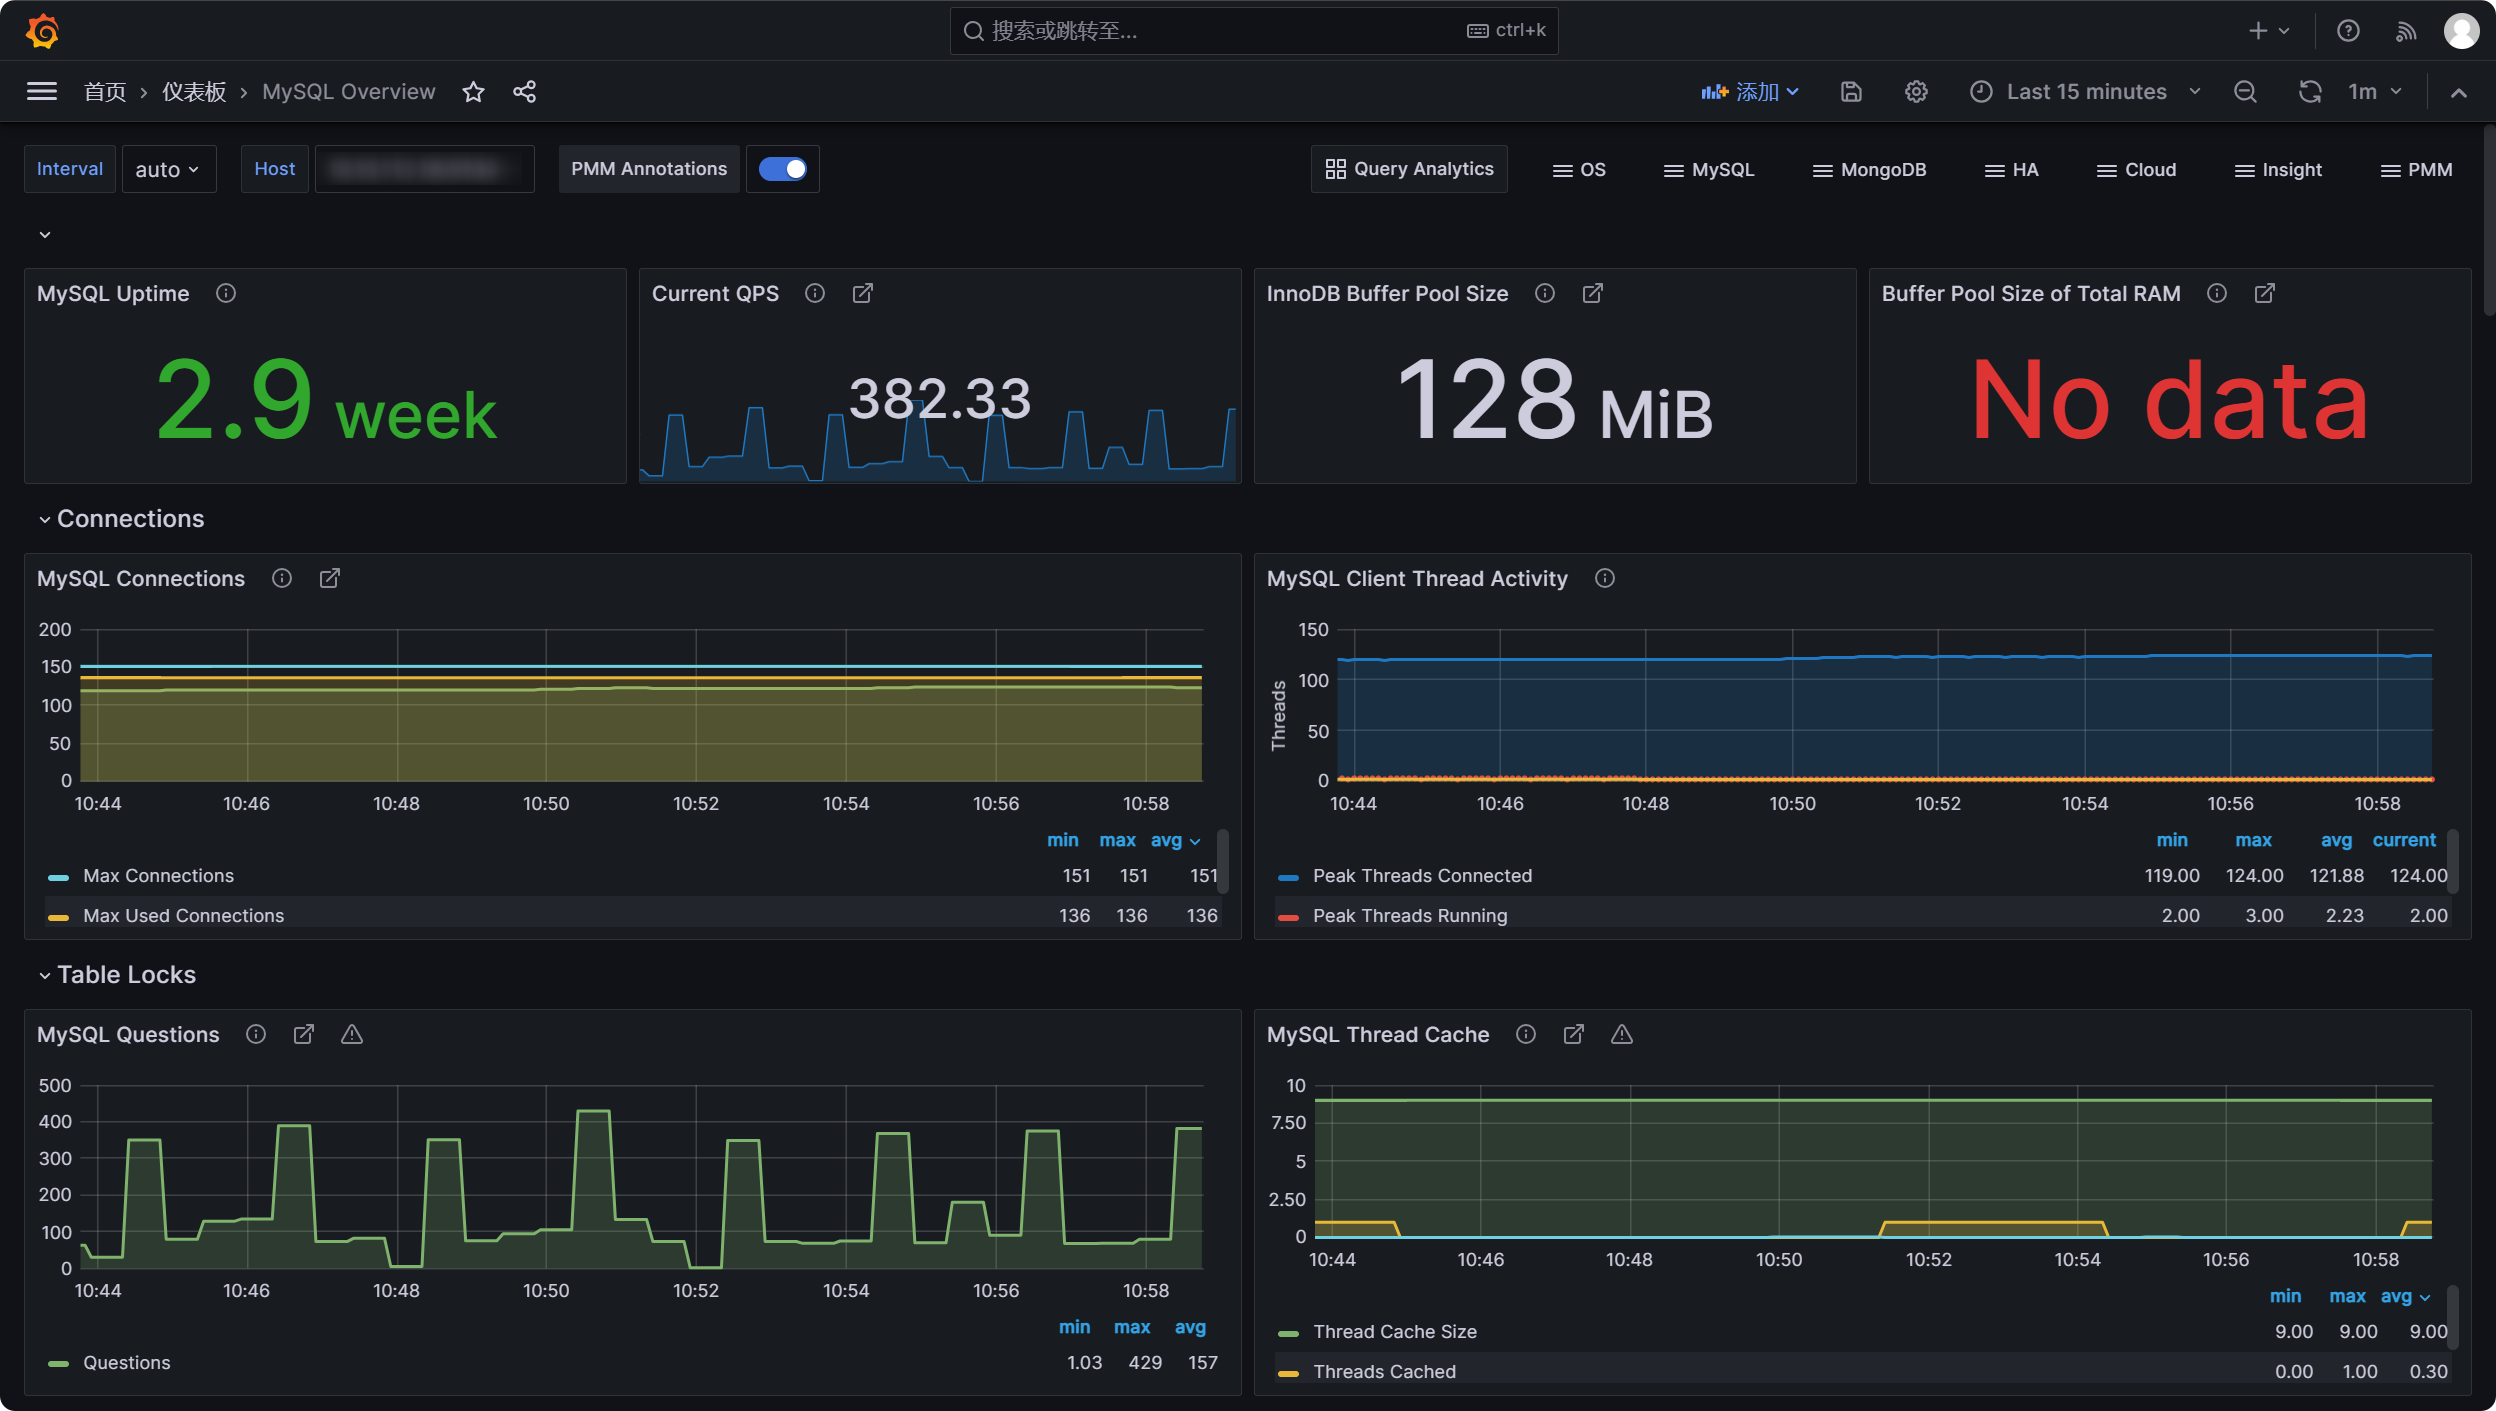
在Grafana创建Dashboard可视化地观测数据,这里可以选择监控模版来显示mysql的关键指标,模版ID为7362

 浙公网安备 33010602011771号