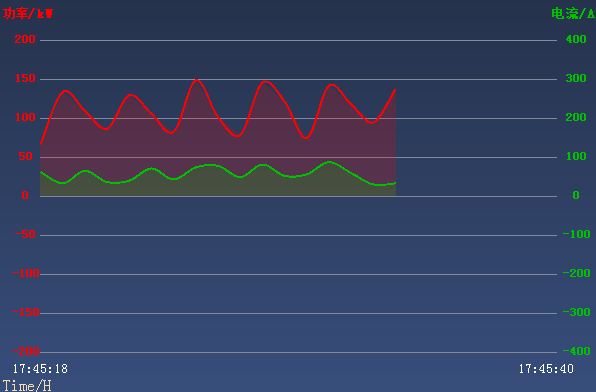
直接上效果图如下
public partial class WaveChartUserCtrl : UserControl
{
Color axisColor = Color.FromArgb(69, 200, 255);//坐标颜色
Color scaleColor = Color.FromArgb(129, 137, 156);//刻度颜色
Font axisFont = new Font("宋体", 9, FontStyle.Bold);//坐标字体
/// <summary>
/// 画板宽度
/// </summary>
private float boardWidth;
/// <summary>
/// 画板高度
/// </summary>
private float boardHeight;
/// <summary>
/// 垂直(纵向)边距(画图区域距离左右两边长度)
/// </summary>
private float verticalMargin;
/// <summary>
/// 平行(横向)边距(画图区域距离左右两边长度)
/// </summary>
private float horizontalMargin;
/// <summary>
/// 水平间距像素
/// </summary>
private float horizontalBetween;
/// <summary>
/// 垂直间距像素
/// </summary>
private float verticalBetween;
/// <summary>
/// 图表区域宽度
/// </summary>
float chartWidth;
/// <summary>
/// 图表区域高度
/// </summary>
float charHeight;
/// <summary>
/// 画图区域起点
/// </summary>
PointF startPostion;
/// <summary>
/// 画图区域终点
/// </summary>
PointF endPostion;
/// <summary>
/// 左边Y轴每个间隔值
/// </summary>
private int leftIntervalValueY;
/// <summary>
/// 右边Y抽每个间隔值
/// </summary>
private int rightIntervalValueY;
/// <summary>
/// X轴每个间隔值
/// </summary>
//private int intervalValueX;
/// <summary>
/// X轴刻度线数量
/// </summary>
private int xScaleCount = 20;
/// <summary>
/// X轴刻度线数量
/// </summary>
public int XscaleCount
{
get
{
return xScaleCount;
}
set
{
xScaleCount = value;
}
}
/// <summary>
/// Y轴刻度线数量
/// </summary>
private int yScaleCount = 8;
/// <summary>
/// Y轴刻度线数量
/// </summary>
public int YscaleCount
{
get
{
return yScaleCount;
}
}
private float leftmaxValue = 300;
[Category("wyl")]
[Description("左边坐标最大值")]
public float LeftMaxValue
{
get
{
return leftmaxValue;
}
set
{
if (value <= LeftMinValue)
{
MessageBox.Show("最大值不能低于最小值!", "警告", MessageBoxButtons.OK, MessageBoxIcon.Warning);
//maxValue = 300;
}
else
{
leftmaxValue = value;
}
}
}
private float leftminValue = 0;
/// <summary>
/// 仪表盘显示的最小值
/// </summary>
[Category("wyl")]
[Description("左边坐标最小值")]
public float LeftMinValue
{
get
{
return leftminValue;
}
set
{
if (value >= LeftMaxValue)
{
MessageBox.Show("最小值不能超过最大值!", "警告", MessageBoxButtons.OK, MessageBoxIcon.Warning);
//minValue = 0;
}
else
{
leftminValue = value;
}
}
}
private float rightmaxValue = 100;
[Category("wyl")]
[Description("右边坐标最大值")]
public float RightMaxValue
{
get
{
return rightmaxValue;
}
set
{
if (value <= RightMinValue)
{
MessageBox.Show("最大值不能低于最小值!", "警告", MessageBoxButtons.OK, MessageBoxIcon.Warning);
}
else
{
rightmaxValue = value;
}
}
}
private float rightminValue = 0;
/// <summary>
/// 仪表盘显示的最小值
/// </summary>
[Category("wyl")]
[Description("右边坐标最小值")]
public float RightMinValue
{
get
{
return rightminValue;
}
set
{
if (value >= RightMaxValue)
{
MessageBox.Show("最小值不能超过最大值!", "警告", MessageBoxButtons.OK, MessageBoxIcon.Warning);
}
else
{
rightminValue = value;
//InitCanvas();
}
}
}
private List<Color> lineColor = new List<Color> { Color.Red, Color.FromArgb(0, 192, 0) };
[Category("wyl")]
[Description("线条颜色")]
public List<Color> LineColor
{
get
{
return lineColor;
}
set
{
if (value != null && value.Count > 1)
{
lineColor = value;
}
}
}
/// <summary>
/// 显示文字
/// </summary>
string titlText1 = "";
/// <summary>
/// 显示文字
/// </summary>
[Category("wyl")]
[Description("标题1")]
public string TitlText1
{
get
{
return titlText1;
}
set
{
titlText1 = value;
}
}
/// <summary>
/// 显示文字
/// </summary>
string titlText2 = "";
/// <summary>
/// 显示文字
/// </summary>
[Category("wyl")]
[Description("标题2")]
public string TitlText2
{
get
{
return titlText2;
}
set
{
titlText2 = value;
}
}
/// <summary>
/// 数据源1
/// </summary>
private Series SeriesData1 = new Series();
/// <summary>
/// 数据源2
/// </summary>
private Series SeriesData2 = new Series();
/// <summary>
/// 真实画布宽度为画板的80% ,其余部分预留。
/// </summary>
private float canvasWidth;
/// <summary>
/// 最大X抽坐标为24H,最后记录一分钟记录一次
/// </summary>
private int MaxXScaleCount = 720;//24 * 60 / 2;//2秒通讯一次,最大每一分钟记录一次
//private List<float> dataLst1 = new List<float>();
//private List<float> dataLst2 = new List<float>();
public DateTime startTime = DateTime.Now;
public void InitCanvas()
{
boardWidth = this.ClientSize.Width;
boardHeight = this.ClientSize.Height;
horizontalMargin = 40;
verticalMargin = 40;
chartWidth = boardWidth - 2 * horizontalMargin;//画图区域宽度
charHeight = boardHeight - 2 * verticalMargin; //画图区域高度,axisY 避免与X轴重合
canvasWidth = chartWidth * 0.86F;//实际画布为画板的80%
startPostion = new PointF(horizontalMargin, verticalMargin);
endPostion = new PointF(boardWidth - horizontalMargin, boardHeight - verticalMargin);
//SeriesData1.LineColor = Color.Red;
//SeriesData2.LineColor = Color.FromArgb(0, 192, 0);
}
public WaveChartUserCtrl()
{
InitializeComponent();
this.SetStyle(ControlStyles.OptimizedDoubleBuffer
| ControlStyles.AllPaintingInWmPaint
| ControlStyles.DoubleBuffer, true);
InitCanvas();
}
/// <summary>
/// 画图
/// </summary>
/// <param name="gp"></param>
private void Drawing(Graphics gs)
{
System.Diagnostics.Stopwatch runstopwatch = new System.Diagnostics.Stopwatch();
runstopwatch.Start();
if (SeriesData1.Datas.Count > 20)
{
XscaleCount = SeriesData1.Datas.Count;
}
horizontalBetween = canvasWidth / XscaleCount;
verticalBetween = charHeight / YscaleCount;
//intervalValueX = 1;//
leftIntervalValueY = (int)(LeftMaxValue - LeftMinValue) / YscaleCount;
rightIntervalValueY = (int)(RightMaxValue - RightMinValue) / YscaleCount;
try
{
StringFormat strFmt = new System.Drawing.StringFormat();
strFmt.Alignment = StringAlignment.Center; //文本水平居中
strFmt.LineAlignment = StringAlignment.Center; //文本垂直居中
Pen axisPen = new Pen(scaleColor, 1.0F);//坐标文字
Bitmap bit = new Bitmap((int)boardWidth, (int)boardHeight);
Graphics g = Graphics.FromImage(bit);
//g.DrawString(TitlText, new Font("宋体", 9, FontStyle.Bold), new SolidBrush(SeriesData1.LineColor), 5, 10);
float tempEndPointY = endPostion.Y;
//Y轴格
for (int i = 0; i <= YscaleCount; i++)
{
float y = tempEndPointY - i * verticalBetween;
g.DrawLine(axisPen, startPostion.X, y, endPostion.X, y);
string leftText = (LeftMinValue + (i * leftIntervalValueY)).ToString();
SizeF sf = g.MeasureString(leftText, axisFont);
RectangleF rf = new RectangleF(startPostion.X - 30, y - sf.Height / 2, 30, sf.Height);
g.DrawString(leftText, axisFont, new SolidBrush(LineColor[0]), rf, strFmt);
string rightText = (RightMinValue + (i * rightIntervalValueY)).ToString();
sf = g.MeasureString(rightText, axisFont);
RectangleF rf1 = new RectangleF(endPostion.X + 5, y - sf.Height / 2, 30, sf.Height);
g.DrawString(rightText, axisFont, new SolidBrush(LineColor[1]), rf1, strFmt);
}
//画曲线
if (SeriesData1 != null)
{
strFmt.Alignment = StringAlignment.Near; //
RectangleF rf = new RectangleF(0, 0, 70, 30);
g.DrawString(TitlText1, new Font("宋体", 10, FontStyle.Bold), new SolidBrush(LineColor[0]), rf, strFmt);
//计算0值的坐标
int tempv = (int)((Math.Abs(LeftMinValue) - 0) / leftIntervalValueY);//得到0到最小值的间隔距离;
float zeroY = tempEndPointY - tempv * verticalBetween;//值为0点Y抽坐标;
if (SeriesData1.Datas.Count > 1)
{
int dataIndex = 0;
PointF[] arrDataPoint = new PointF[SeriesData2.Datas.Count];
int index = 0;
foreach (PointF pf in SeriesData1.Datas)
{
PointF p = new PointF();
p.X = startPostion.X + horizontalBetween * index;
p.Y = zeroY - verticalBetween * pf.Y / leftIntervalValueY;
arrDataPoint[dataIndex++] = p;
index++;
}
g.DrawCurve(new Pen(new SolidBrush(LineColor[0]), 2F), arrDataPoint);
PointF[] AreaPf = new PointF[arrDataPoint.Length + 2];
int AreaIndxe = 0;
AreaPf[AreaIndxe++] = new PointF(startPostion.X, zeroY);
foreach (PointF p in arrDataPoint)
{
AreaPf[AreaIndxe++] = p;
}
AreaPf[AreaIndxe++] = new PointF(arrDataPoint[arrDataPoint.Length - 1].X, zeroY);
g.FillPolygon(new SolidBrush(Color.FromArgb(50, LineColor[0])), AreaPf);
//g.FillClosedCurve(new SolidBrush(Color.FromArgb(50, SeriesData1.LineColor)), AreaPf);
//g.DrawEllipse(new Pen(Brushes.Red), startPostion.X, zeroY, 10, 10);
}
}
if (SeriesData2 != null)
{
strFmt.Alignment = StringAlignment.Far; //
RectangleF rf = new RectangleF(boardWidth - 70, 0, 70, 30);
g.DrawString(TitlText2, new Font("宋体", 10, FontStyle.Bold), new SolidBrush(LineColor[1]), rf, strFmt);
//计算0值的坐标
int tempv = (int)((Math.Abs(RightMinValue) - 0) / rightIntervalValueY);//得到0到最小值的间隔距离;
float zeroY = tempEndPointY - tempv * verticalBetween;//值为0点Y抽坐标;
if (SeriesData2.Datas.Count > 1)
{
int dataIndex = 0;
PointF[] arrDataPoint = new PointF[SeriesData2.Datas.Count];
int index = 0;
foreach (PointF pf in SeriesData2.Datas)
{
PointF p = new PointF();
p.X = startPostion.X + horizontalBetween * index;
p.Y = zeroY - verticalBetween * pf.Y / rightIntervalValueY;
arrDataPoint[dataIndex++] = p;
index++;
}
g.DrawCurve(new Pen(new SolidBrush(LineColor[1]), 2F), arrDataPoint);
PointF[] AreaPf = new PointF[arrDataPoint.Length + 2];
int AreaIndxe = 0;
AreaPf[AreaIndxe++] = new PointF(startPostion.X, zeroY);
foreach (PointF p in arrDataPoint)
{
AreaPf[AreaIndxe++] = p;
}
AreaPf[AreaIndxe++] = new PointF(arrDataPoint[SeriesData2.Datas.Count - 1].X, zeroY);
g.FillPolygon(new SolidBrush(Color.FromArgb(50, LineColor[1])), AreaPf);
}
}
g.DrawString(startTime.ToString("HH:mm:ss"), new Font("宋体", 10, FontStyle.Regular), Brushes.White, 10, this.ClientSize.Height - 30);
g.DrawString(DateTime.Now.ToString("HH:mm:ss"), new Font("宋体", 10, FontStyle.Regular), Brushes.White, this.ClientSize.Width - 80, this.ClientSize.Height - 30);
g.DrawString("Time/H", new Font("宋体", 12, FontStyle.Regular), Brushes.Wheat, 0, this.ClientSize.Height - 15);
gs.DrawImage(bit, 0, 0);
g.Dispose();
runstopwatch.Stop();
TimeSpan timespan = runstopwatch.Elapsed;
Console.WriteLine("Drawing:" + timespan.ToString());
}
catch (Exception ex)
{
Console.WriteLine(ex.Message);
}
}
private void WaveChartUserCtrl_Resize(object sender, EventArgs e)
{
InitCanvas();
this.Refresh();
}
private void WaveChartUserCtrl_Paint(object sender, PaintEventArgs e)
{
Drawing(e.Graphics);
}
public void AddSeriesData(List<float> dataLst1, List<float> dataLst2)
{
//System.Diagnostics.Stopwatch runstopwatch = new System.Diagnostics.Stopwatch();
//runstopwatch.Start();
//dataLst1.Add(y1);
//dataLst2.Add(y2);
//if (dataLst1.Count > 86400)
//{
// dataLst1.RemoveAt(0);
//}
//if (dataLst2.Count > 86400)
//{
// dataLst2.RemoveAt(0);
//}
int tempx = dataLst1.Count / MaxXScaleCount + 1;
SeriesData1.Datas.Clear();
for (int index = 0; index < dataLst1.Count; index++)
{
PointF p1 = new PointF(0, dataLst1[index]);
if (index % tempx == 0 || index == dataLst1.Count)
{
SeriesData1.Datas.Add(p1);
}
}
SeriesData2.Datas.Clear();
for (int index = 0; index < dataLst2.Count; index++)
{
PointF p2 = new PointF(0, dataLst2[index]);
if (index % tempx == 0 || index == dataLst2.Count)
{
SeriesData2.Datas.Add(p2);
}
}
//runstopwatch.Stop();
//TimeSpan timespan = runstopwatch.Elapsed;
//Console.WriteLine(timespan.ToString());
//this.Refresh();
}
}
/// <summary>
/// 数据系列管理
/// </summary>
public class Series
{
/// <summary>
/// 标题
/// </summary>
public string HeadText = "title";
Color lineColor = Color.Red;
/// <summary>
/// 当前画笔颜色
/// </summary>
public Color LineColor
{
get
{
return lineColor;
}
set
{
lineColor = value;
}
}
public List<PointF> Datas = new List<PointF>();
}

 浙公网安备 33010602011771号