机器学习算法—分类边界的绘制
import matplotlib.pyplot as plt
import numpy as np
from sklearn.linear_model import LogisticRegression
from sklearn.datasets import make_blobs
data = make_blobs(n_samples=10, centers =2,random_state=8)
X, y = data
np.set_printoptions()
print(X)
print(y)
[[ 6.26e+00 -4.69e-02]
 [ 8.73e+00  1.02e-02]
 [ 7.32e+00  4.08e-01]
 [ 5.17e+00  1.18e+01]
 [ 5.52e+00  7.98e+00]
 [ 8.26e+00  1.03e+01]
 [ 6.29e+00  1.13e+01]
 [ 8.24e+00  3.86e-01]
 [ 7.01e+00 -1.75e-01]
 [ 9.20e+00  1.16e+01]]
[1 1 1 0 0 0 0 1 1 0]
alg = LogisticRegression()
alg.fit(X,y)
LogisticRegression(C=1.0, class_weight=None, dual=False, fit_intercept=True,
                   intercept_scaling=1, l1_ratio=None, max_iter=100,
                   multi_class='auto', n_jobs=None, penalty='l2',
                   random_state=None, solver='lbfgs', tol=0.0001, verbose=0,
                   warm_start=False)
x_min, x_max = X[:, 0].min() - 1, X[:, 0].max() + 1 # 获取第一列的最小和最大值
y_min, y_max = X[:, 1].min() - 1, X[:, 1].max() + 1 # 获取第二列的最小和最大值
xx, yy = np.meshgrid(np.arange(x_min, x_max, .02),
np.arange(y_min, y_max, .02))
Z = alg.predict(np.c_[xx.ravel(), yy.ravel()])
Z = Z.reshape(xx.shape)
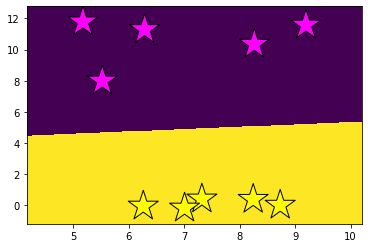
plt.pcolormesh(xx, yy, Z, shading='auto',)
plt.scatter(X[:, 0], X[:, 1], c=y, cmap='spring', edgecolor='k', marker='*', s=1000)
plt.show()
关于meshgrid
x1 = np.linspace(0, 1, 5)
x2 = np.linspace(0, 1, 2)
print(x1)
print(x2)
[0.   0.25 0.5  0.75 1.  ]
[0. 1.]
xx, yy = np.meshgrid(x1, x2)
print(xx)  # 沿着axis=0的方向,重复2次【因为y有2个值】
print(yy)  # 沿着axis=1的方向,重复5次【因为x有5个值】
[[0.   0.25 0.5  0.75 1.  ]
 [0.   0.25 0.5  0.75 1.  ]]
[[0. 0. 0. 0. 0.]
 [1. 1. 1. 1. 1.]]
out = np.c_[xx.ravel(), yy.ravel()] # 结果为n行2列。【n=两个数组的长度乘积】
print(out)
[[0.   0.  ]
 [0.25 0.  ]
 [0.5  0.  ]
 [0.75 0.  ]
 [1.   0.  ]
 [0.   1.  ]
 [0.25 1.  ]
 [0.5  1.  ]
 [0.75 1.  ]
 [1.   1.  ]]
Z = np.random.randint(0,2, (2,5))
# Z = Z.reshape(xx.shape)  # Z 重新转换为二维数组
print(Z)
[[1 0 0 0 0]
 [0 1 0 1 1]]
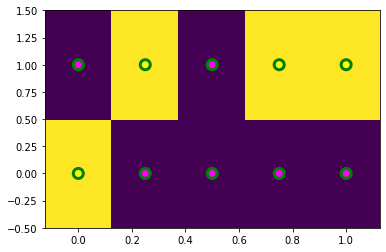
plt.pcolormesh(xx, yy, Z,  shading='auto',)  #xx和yy对应位置可以得到一个坐标点,Z为预测结果

plt.scatter(xx.reshape(-1,) ,yy.reshape(-1,), marker='o', s=100, c=Z.reshape(-1,), cmap='spring', edgecolor='g', linewidth=3)
感谢张大娃——
人世几回伤往事,山形依旧枕寒流

 浙公网安备 33010602011771号