
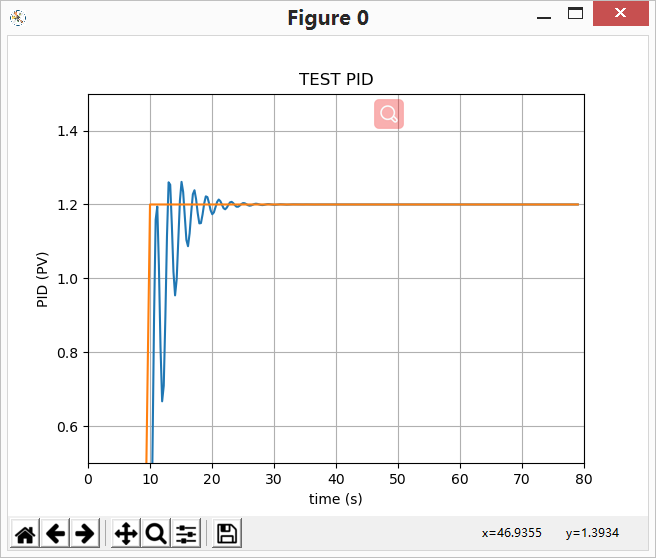
python 位置式pid计算仿真
import time
import matplotlib
import matplotlib.pyplot as plt
import numpy as np
from scipy.interpolate import make_interp_spline as spline

class PID:
    def __init__(self, P=0.2, I=0.0, D=0.0):
        self.kp = P
        self.ki = I
        self.kd = D

        self.setValue = 0

        self.lastErr = 0
        self.errSum = 0
        self.errSumLimit = 10

    def pidCalculate(self, curValue):
        err = self.setValue - curValue
        dErr = err - self.lastErr
        self.lastErr = err

        self.errSum += err
        if (self.errSum < -self.errSumLimit):
            self.errSum = -self.errSumLimit
        elif (self.errSum > self.errSumLimit):
            self.errSum = self.errSumLimit

        self.output = self.kp * err + (self.ki * self.errSum) + (self.kd * dErr)
        return self.output

def testPid(P = 0.2, I = 0.0, D = 0.0, Len = 100):
    pid = PID(P, I, D)
    pid.setValue = 0
    curValue = 0

    curValueList = []
    timeList = []
    setValueList = []

    for i in range(1, Len):
        out = pid.pidCalculate(curValue)
        curValue = out
        if i > 9:
            pid.setValue = 1.2
        time.sleep(0.01)

        curValueList.append(curValue)
        setValueList.append(pid.setValue)
        timeList.append(i)

    timeSm = np.array(timeList)
    timeSmooth = np.linspace(timeSm.min(), timeSm.max(), 300)   #将x轴300等分
    curValueSmooth = spline(timeList, curValueList)(timeSmooth) #插值.使原y轴数据平滑
    plt.figure(0)
    plt.plot(timeSmooth, curValueSmooth)
    plt.plot(timeList, setValueList)
    plt.xlim((0, Len))
    plt.ylim((min(curValueList)-0.5, max(curValueList)+0.5))
    plt.xlabel('time (s)')
    plt.ylabel('PID (PV)')
    plt.title('TEST PID')

    plt.ylim((1-0.5, 1+0.5))

    plt.grid(True)
    plt.show()

if __name__ == "__main__":
    testPid(0.35, 0.6, 0.05, Len=80)
代码环境:
python:3.7.0
matplotlib 3.2.1
numpy 1.17.3
scipy 1.4.1

 浙公网安备 33010602011771号