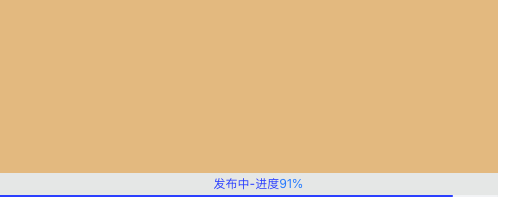
最终结果图

还是直接上代码哈,我这里直接用的react的hook写的,最近这一年没怎么有时间更新博客,这两年我换技术栈了,换成react了,中间写了很多组件,后面我有空了全部都更新出来吧,不过都是react的哦,当然有时候vue也在使用哈,一般我都是直接上代码,不存在过多的讲解,因为不是特别难的代码,一看就明白。
js
     const [publish, setPublish] = useState(false);
    const [publishPercent, setPublishPercent] = useState(0);
   const handleAppStart = async () => {
        setPublish(true);
        setPublishPercent((value) => {
          return 10;
        });
        const ani = setInterval(() => {
            const loadingWidth = publishPercent;
            const bodyWidth = 100;
            if (loadingWidth < bodyWidth) {
                setPublishPercent((value) => {
                  return value + (bodyWidth - value) * 0.005;
                });
            }
        }, 100);
        const clearAni = () => {
            clearInterval(ani);
            setTimeout(() => {
                setPublish(false);
            }, 500);
        };
        //这里是借口拉,成功的话就会变成100%拉,
        // axios.post(`URL`).then(res => {

        //                         setPublishPercent(100);
        //                         clearAni();
        //     } else {
        //         Message.error('发布失败!');
        //         clearAni();
        //     }
        // }).catch(err => {
        //     console.log(err);
        //     Message.error('发布失败!');
        //     clearAni();
        // });

      };
html
 <div className="text">
                   发布中-进度
      <span className="percent">{Math.floor(publishPercent)}%</span>
  </div>
css
.box{
    width: 500px;
    height: 200px;
    background: burlywood;
    position: relative;
    .publish-loading {
        position: absolute;
        bottom: 0px;
        width: 100%;
        height: 24px;
        background: rgba(232, 243, 255, 0.8);
        z-index: 100;
        .line {
            width: 100%;
            height: 2px;
            background: #f2f3f5;
            position: absolute;
            bottom: 0px;
            z-index: 8;
            border-radius: 4px;
        }
        .active-line {
            height: 2px;
            background: #165dff;
            position: absolute;
            bottom: 0px;
            z-index: 8;
            border-radius: 4px;
            transition: all .2s ease;
        }
        .text {
            width: 100%;
            text-align: center;
            padding: 0px 10px;
            color: #165DFF;
            line-height: 22px;
            .percent {
                color: #2d84fb;
                font-weight: 400;
            }
        }
    }
}
在react中使用echarts实现进度条,下面是最终效果图

import * as echarts from 'echarts';
import React, { useEffect,useRef,useState } from 'react';
  const chartRef = useRef<any>(null);
    const [myChart,setMyChart] =useState<any>();
    const initChart=()=>{
        if(!chartRef.current){
          return;
        }
        var myChart = echarts.init(chartRef.current);
        var data = ['数据一', '数据二', '数据三'];
        var value = [0.6, 0.95, 0.85];
        var arr = new Array(value.length).fill(1);
        let option = {
            backgroundColor: '#000',
            grid: {
             top: '8%',
             left: '15%',
             right: '17.3%',
             bottom: '10%',
            },
            tooltip: { show: false },
            xAxis: {
             type: 'value',
             min: 0,
             max: 1,
             axisLine: { show: false },
             splitLine: { show: false },
             axisLabel: { show: false },
             axisTick: { show: false },
            },
            yAxis: {
             //show: false,
             type: 'category',
             inverse: true,
             splitLine: { show: false },
             axisLine: { show: false },
             axisLabel: {
              show: true,
              interval: 0,
              margin: 10,
              textStyle: {
               color: '#ffffff',
               fontSize: 16,
               fontWeight: 'bold',
              },
             },
             axisTick: { show: false },
             data: data,
            },
            series: [
             {
              //渐变数据内容
              type: 'bar',
              barWidth: '34%',
              animationDuration: 2000,
              itemStyle: {
               normal: {
                borderWidth: 0,
                color: {
                 type: 'linear',
                 x: 0,
                 y: 0,
                 x2: 1,
                 y2: 0,
                 colorStops: [
                  {
                   offset: 0,
                   color: '#00a0e9',
                  },
                  {
                   offset: 1,
                   color: '#00ffff',
                  },
                 ],
                },
               },
              },
              label: {
               show: false,
              },
              data: value,
              z: 0,
             },
             {
              //背景柱状图
              type: 'bar',
              barWidth: '34%',
              barGap: '-100%',
              animation: false,
              itemStyle: {
               normal: {
                borderWidth: 0,
                color: 'rgba(0,202,255,0.2)',
               },
              },
              data: arr,
              z: 0,
             },

             {
              //辅助分割图形
              type: 'pictorialBar',
              barWidth: '34%',
              symbol: 'rect',
              // symbolRotate:"-20",
              symbolMargin: '200%', //控制分割图形的大小
              symbolSize: [4, '100%'],
              symbolRepeat: true,
              animation: false,
              itemStyle: {
               normal: {
                color: '#000',
               },
              },
              label: {
               normal: {
                color: '#fff',
                show: true,
                position: ['101%', '40%'],
                fontSize: 22,
                fontWeight: 'bold',
                formatter: function (params) {
                 return ' ' + value[params.dataIndex] * 100 + '%';
                },
               },
              },
              data: arr,
              z: 1,
             },
            ],
           };
        option && myChart.setOption(option);
        setMyChart(myChart);
        window.onresize = function(){
            if(myChart) {
              myChart.resize();
            }
        }
      };
	useEffect(() => {
        initChart()
	}, []);
return (
		<div
			className="test">
            <div className="view-dashboard">
                <div className="chart" id={'dataGraph'} ref={chartRef}></div>
            </div>
		</div>
	)
css
  .view-dashboard{
      padding: 40px;
      background: #F9FBFD;
      .chart{
        min-height: 240px;
        min-width: 240px;
    }
  }
html+css+js 实现进度条

html
<div class="progress-container">
  <div class="squares-progress">
    <div class="square"></div>
    <div class="square"></div>
    <div class="square"></div>
    <div class="square"></div>
    <div class="square"></div>
    <div class="square"></div>
    <div class="square"></div>
    <div class="square"></div>
    <div class="square"></div>
    <div class="square"></div>
  </div>
</div>
css
.progress-container {
  display: flex;
  justify-content: center;
  align-items: center;
  min-height: 100px;
  padding: 20px;
}

.squares-progress {
  display: flex;
  gap: 5px;
}

.square {
  width: 20px;
  height: 20px;
  background-color: #e0e0e0;
}
js
function updateProgress(percent) {
  const squares = document.querySelectorAll('.square');
  const totalSquares = squares.length;
  const percentPerSquare = 100 / totalSquares;

  squares.forEach((square, index) => {
    const startPercent = index * percentPerSquare;
    const endPercent = (index + 1) * percentPerSquare;

    if (percent >= endPercent) {
      // 完全填充
      square.style.background = '#2196f3';
    } else if (percent > startPercent && percent < endPercent) {
      // 部分填充
      const squareProgress = ((percent - startPercent) / percentPerSquare) * 100;
      square.style.background = `linear-gradient(to right, #2196f3 ${squareProgress}%, #e0e0e0 ${squareProgress}%)`;
    } else {
      // 未填充
      square.style.background = '#e0e0e0';
    }
  });
}

// 测试不同进度
// updateProgress(2); // 显示2%进度
// updateProgress(15); // 显示15%进度
// updateProgress(73); // 显示73%进度

// 动态演示
let progress = 0;
setInterval(() => {
  progress = (progress + 0.5) % 100;
  updateProgress(progress);
}, 50);


 浙公网安备 33010602011771号