<script setup lang="ts">
import { ref, onMounted } from 'vue'
import * as echarts from 'echarts'
const echartsRef = ref(null)
onMounted(() => {
const myChart = echarts.init(echartsRef.value)
let option = {
backgroundColor: '#14315C',
tooltip: {
trigger: 'axis',
},
legend: {
orient: 'horizontal', // 或者 'vertical'
x: 'center', // 或者 'left', 'right'
y: 'top', // 或者 'bottom', 'middle'
data: ['2020-03-20', '2021-03-20'],
textStyle: {
color: '#fff', // 文字颜色
fontSize: 16, // 字体大小
},
icon: 'rect', // 设置图标类型为矩形
itemGap: 500 // 默认值通常为 10,你可以根据需要调整这个值
},
xAxis: [
{
type: 'category',
axisTick: { // 移除刻度线
show: false
},
data: [
'00:00', '01:00', '02:00', '03:00', '04:00', '05:00', '06:00', '07:00',
'08:00', '09:00', '10:00', '11:00', '12:00', '13:00', '14:00', '15:00',
'16:00', '17:00', '18:00', '19:00', '20:00', '21:00', '22:00', '23:00'
],
axisPointer: {
type: 'shadow'
},
axisLabel: {
// 自定义 X 轴标签的字体样式
textStyle: {
color: '#FFFFFF', // 更改文字颜色
fontSize: 12 // 更改文字大小
},
// 自定义 X 轴标签的格式
// 仅显示 "00:00", "05:00", "10:00", "15:00", "20:00" 这几个时间点
formatter: function (value: any, index: any) {
// 定义要显示的时间点的索引
const visibleIndex = [0, 5, 10, 15, 20]; // 分别对应 "00:00", "05:00", "10:00", "15:00", "20:00"
// 如果当前索引在可见索引数组中,则显示该时间点
if (visibleIndex.includes(index)) {
return value;
}
return ''; // 否则不显示
}
}
}
],
yAxis: [
{
type: 'value',
min: 1.2,
max: 2,
interval: 0.2,
splitLine: {
lineStyle: {
type: 'dashed', // 将实线更改为虚线
color: '#ccc',
width: 1.5, // 线宽
}
},
// 自定义 Y 轴标签的字体样式
axisLabel: {
formatter: '{value}',
// 自定义 X 轴标签的字体样式
textStyle: {
color: '#FFFFFF', // 更改文字颜色
fontSize: 12 // 更改文字大小
},
},
}
],
series: [
// 柱状图
{
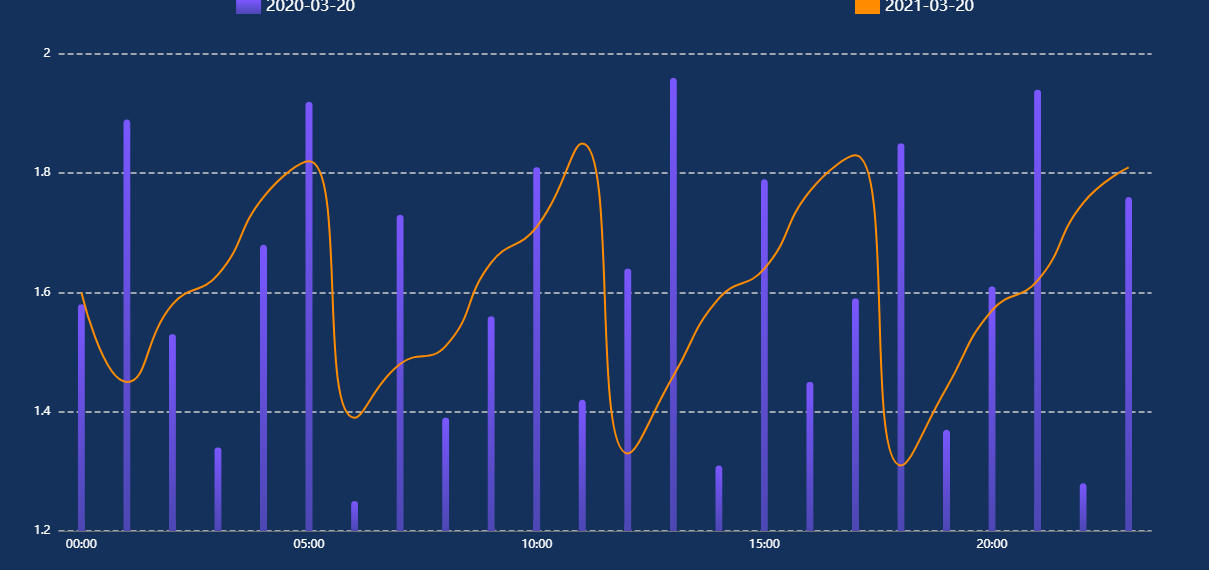
name: '2020-03-20',
type: 'bar',
barWidth: '15%',
itemStyle: {
borderRadius: [5, 5, 0, 0], // 这里设置圆角的大小
color: {
// 线性渐变,前四个参数分别是 x0, y0, x2, y2, 范围从 0 - 1,分别表示右, 下, 左, 上
type: 'linear',
x: 0,
y: 0,
x2: 0,
// 渐变结束位置
y2: 2,
colorStops: [{
offset: 0, color: '#7A57FF' // 0% 处的颜色
}, {
offset: 1, color: '#1f3767' // 100% 处的颜色
}]
}
},
data: [
1.58, 1.89, 1.53, 1.34, 1.68, 1.92, 1.25, 1.73,
1.39, 1.56, 1.81, 1.42, 1.64, 1.96, 1.31, 1.79,
1.45, 1.59, 1.85, 1.37, 1.61, 1.94, 1.28, 1.76
]
},
// 折线图
{
name: '2021-03-20',
type: 'line',
// 折线平滑
smooth: true,
// 折线拐点不显示
symbol: 'none',
itemStyle: {
color: '#FF8C00' // 设置折线的颜色
},
data: [
1.6, 1.45, 1.58, 1.63, 1.76, 1.82, 1.39, 1.48,
1.51, 1.65, 1.71, 1.85, 1.33, 1.46, 1.59, 1.64,
1.77, 1.83, 1.31, 1.44, 1.57, 1.62, 1.75, 1.81
]
}
]
};
option && myChart.setOption(option)
})
</script>
<template>
<div ref="echartsRef" class="echarts-container" />
</template>
<style scoped>
.echarts-container {
display: flex;
justify-content: center;
align-items: center;
width: 100vw;
height: 100vh;
}
</style>


 浙公网安备 33010602011771号