

SpringCloud 2020.0.4 系列之Hystrix看板
1. 概述
老话说的好:沉默是金,有时适当的沉默,比滔滔不绝更加有效。
言归正传,前面我们聊了有关 Hystrix 降级熔断的话题,今天我们来聊聊如何使用 turbine 和 hystrix dashboard 总览项目的熔断降级情况。
闲话不多说,直接上代码。
2. 暴露业务服务的 actuator 接口
2.1 主要依赖
        <dependency>
            <groupId>org.springframework.boot</groupId>
            <artifactId>spring-boot-starter-actuator</artifactId>
        </dependency>
        <dependency>
            <groupId>org.springframework.cloud</groupId>
            <artifactId>spring-cloud-starter-netflix-hystrix</artifactId>
            <version>2.2.9.RELEASE</version>
        </dependency>
2.2 主要配置
management:
  endpoints:
    web:
      exposure:
        include: '*'
  endpoint:
    health:
      show-details: always
2.3 启动类中需包含 @EnableHystrix 注解
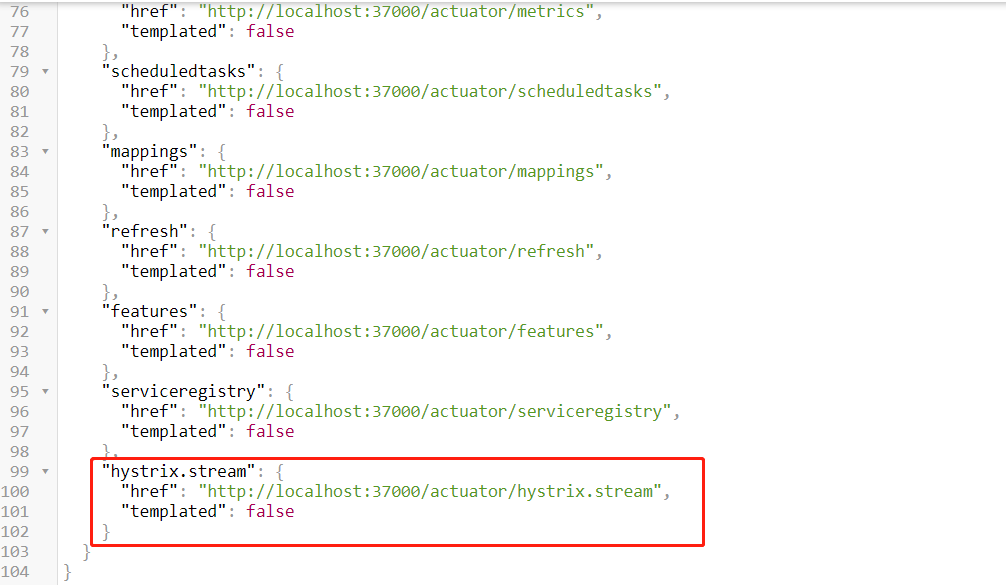
2.4 启动服务,查看接口是否暴露
启动服务后,在浏览器输入 http://服务IP:端口/actuator/,查看是否有 hystrix.stream 接口
3. 新建 turbine 工程
3.1 主要依赖
        <dependency>
            <groupId>org.springframework.cloud</groupId>
            <artifactId>spring-cloud-starter-netflix-eureka-client</artifactId>
        </dependency>
        <dependency>
            <groupId>org.springframework.boot</groupId>
            <artifactId>spring-boot-starter-web</artifactId>
        </dependency>
        <!-- 健康检查 -->
        <dependency>
            <groupId>org.springframework.boot</groupId>
            <artifactId>spring-boot-starter-actuator</artifactId>
        </dependency>
        <dependency>
            <groupId>org.springframework.cloud</groupId>
            <artifactId>spring-cloud-starter-netflix-hystrix</artifactId>
            <version>2.2.9.RELEASE</version>
        </dependency>
        <dependency>
            <groupId>org.springframework.cloud</groupId>
            <artifactId>spring-cloud-starter-netflix-turbine</artifactId>
            <version>2.2.9.RELEASE</version>
        </dependency>
3.2 主要配置
spring:
  application:
    name: my-turbine
  main:
    allow-bean-definition-overriding: true
server:
  port: 38000
management:
  server:
    port: 38001
eureka:
  client:
    service-url:
      defaultZone: http://zhuifengren1:35000/eureka/,http://zhuifengren2:35001/eureka/    # Eureka Server的地址
    healthcheck:
      enabled: true    # 开启健康检查, 依赖于 spring-boot-starter-actuator
  instance:
    lease-renewal-interval-in-seconds: 5      # 发出续约指令的间隔,默认30秒
    lease-expiration-duration-in-seconds: 30  # 租期到期时间,默认90秒

turbine:
  app-config: my-feign,my-eureka-client    # 指定需要监控的服务名,监控多个服务逗号分隔
  cluster-name-expression: '"default"'  # 集群名称
  combine-host-port: true     # 将端口和hostname作为区分不同服务的条件
  aggregator:
    cluster-config: default
3.3 在启动类增加注解
@EnableDiscoveryClient
@EnableHystrix
@EnableTurbine
@EnableAutoConfiguration
public class MyTurbineApplication {

    public static void main(String[] args) {
        SpringApplication.run(MyTurbineApplication.class, args);
    }
}
3.4 启动 turbine 工程,验证接口
启动 turbine 工程后,在浏览器输入 http://服务IP:端口/turbine.stream,调用降级接口后,会显示很多过程数据

4. 新建 hystrix dashboard 工程
注意:此工程不需要注册到 Eureka
4.1 主要依赖
        <dependency>
            <groupId>org.springframework.cloud</groupId>
            <artifactId>spring-cloud-starter-netflix-hystrix</artifactId>
            <version>2.2.9.RELEASE</version>
        </dependency>
        <dependency>
            <groupId>org.springframework.cloud</groupId>
            <artifactId>spring-cloud-starter-netflix-hystrix-dashboard</artifactId>
            <version>2.2.9.RELEASE</version>
        </dependency>
        <dependency>
            <groupId>org.springframework.boot</groupId>
            <artifactId>spring-boot-starter-actuator</artifactId>
        </dependency>
4.2 主要配置
spring:
  application:
    name: my-hystrix-dashboard
  main:
    allow-bean-definition-overriding: true
server:
  port: 39000
4.3 在启动类增加注解
@EnableHystrixDashboard
@SpringCloudApplication
public class MyHystrixDashboardApplication {

    public static void main(String[] args) {
        SpringApplication.run(MyHystrixDashboardApplication.class, args);
    }
}
4.4 启动 hystrix dashboard 服务
4.4.1 启动 hystrix dashboard 服务,然后在浏览器输入 http://服务IP:端口/hystrix
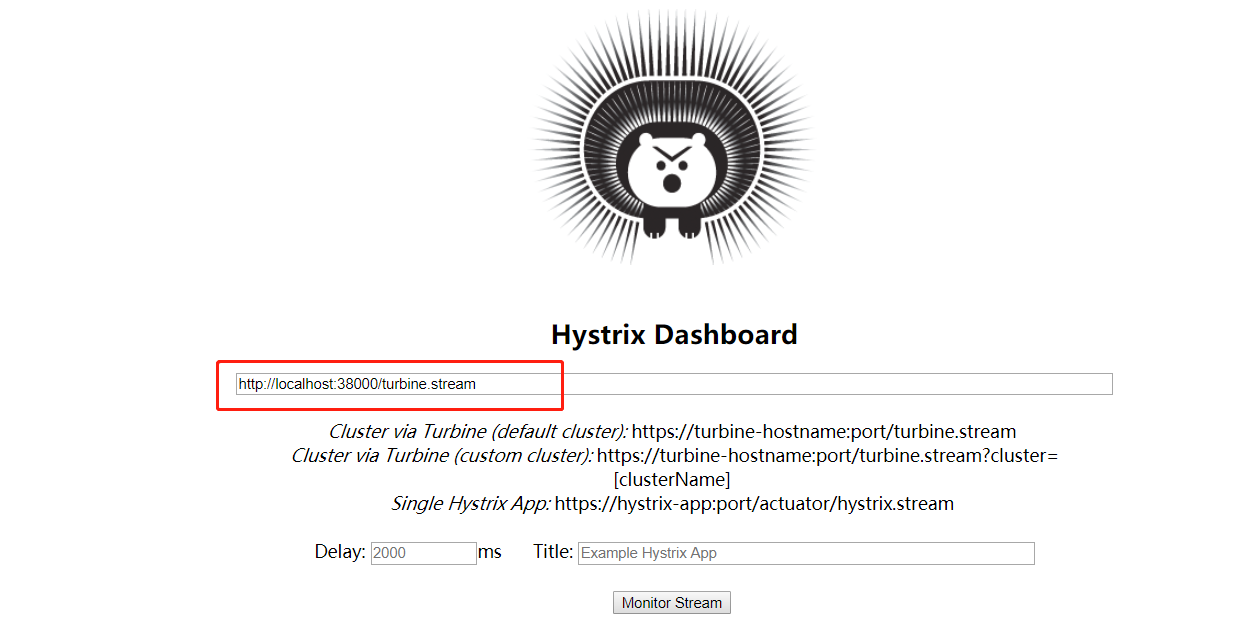
4.4.2 在 Hystrix Dashboard 页面输入 turbine 的地址:http://服务IP:端口/turbine.stream,点击 Monitor Stream 按钮

4.4.3 Unable to connect to Command Metric Stream. 报错解决方案
此时,会报 Unable to connect to Command Metric Stream 字样的错误。
这是因为 turbine 地址的域名不在 hystrix dashboard 的允许列表中, 我们在配置文件中增加 hystrix.dashboard.proxy-stream-allow-list 配置,重启服务即可
spring:
  application:
    name: my-hystrix-dashboard
  main:
    allow-bean-definition-overriding: true
server:
  port: 39000


hystrix:
  dashboard:
    proxy-stream-allow-list: "localhost"
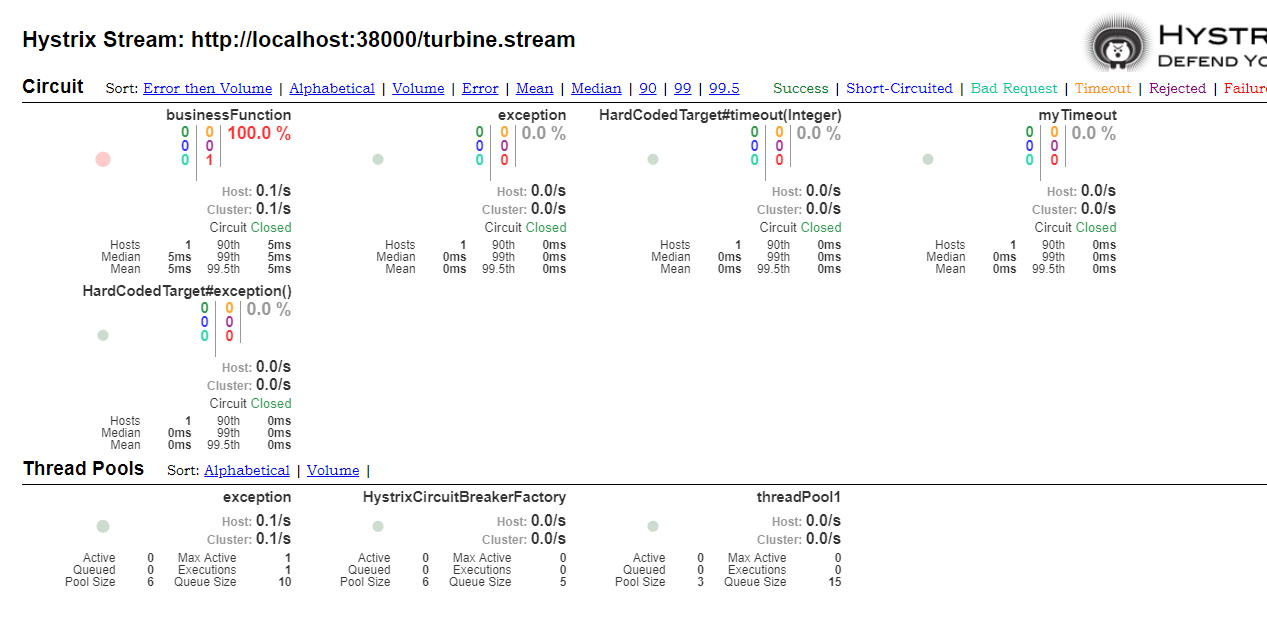
4.4.4 刷新页面,查看 dashboard
5. 综述
今天聊了一下 Hystrix看板,希望可以对大家的工作有所帮助。
欢迎帮忙点赞、评论、转发、加关注 :)
关注追风人聊Java,每天更新Java干货。
6. 个人公众号
追风人聊Java,欢迎大家关注


 浙公网安备 33010602011771号