【Computer Vision】角点检测和匹配——Harris算子
一、基本概念
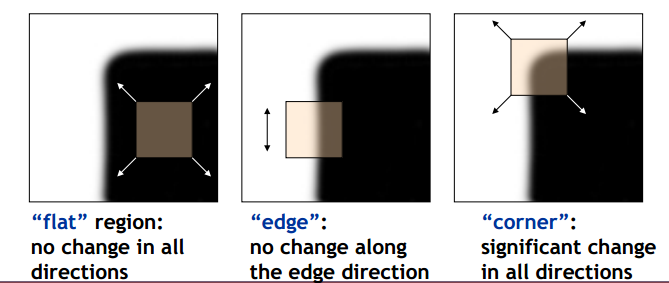
角点corner:可以将角点看做两个边缘的交叉处,在两个方向上都有较大的变化。具体可由下图中分辨出来:
兴趣点interest point:兴趣点是图像中能够较鲁棒的检测出来的点,它不仅仅局限于角点. 也可以是灰度图像极大值或者极小值点等
二、Harris角点检测
Harris 算子是 Haris & Stephens 1988年在 "A Combined Corner and Edge Detector" 中提出的 提出的检测算法, 现在已经成为图像匹配中常用的算法.
对于一幅RGB图像我们很很容易得到corner 是各个方向梯度值较大的点, 定义 函数WSSD(Weighted Sum Squared Difference)为:
$$S(x,y) = \sum_{u} \sum_{v}w(u,v)(I((u+x,v+y)-I(u,v))^2 (1)$$
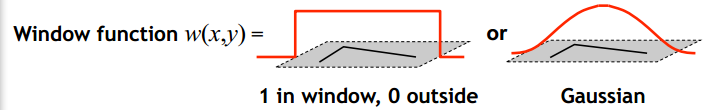
其中$w(u,v)$可以看作采样窗,可以选择矩形窗函数,也可以选择高斯窗函数:
$I(u+x,v+y)-I(u,v)$可以看作像素值变化量(梯度):
使用泰勒展开:$I(u+x,v+y) \approx I(u,v)+I_x(u,v)x+I_y(u,v)y (2)$
(1)代入(2) $S(x,y) \approx \sum_u \sum_v w(u,v) (I_x(u,v)x + I_y(u,v)y)^2$
写成$S(x,y) \approx (x,y) A (x,y)^T $
其中 A 为 二阶梯度矩阵(structure tensor/ second-moment matrix)
$$A = \sum_u \sum_v w(u,v) \begin{bmatrix} I_x^2& I_x I_y \\ I_x I_y & I_y^2 \end{bmatrix} $$
将A定义为Harris Matrix,A 的特征值有三种情况:
1. $\lambda_1 \approx 0, \lambda_2 \approx 0$,那么点$x$不是兴趣点
2. $\lambda_1 \approx 0, \lambda_2$为一个较大的正数, 那么点$x$为边缘点(edge)
3. $\lambda_1, \lambda_2$都为一个较大的正数, 那么点$x$为角点(corner)
由于特征值的计算是 computationally expensive,引入如下函数
$M_c = \lambda_1\lambda_2 - \kappa(\lambda_1+\lambda_2)^2 = det(A) - \kappa trace^2(A) $
为了去除加权常数$\kappa$ 直接计算
$M_{c}^{'} = \frac{det(A)}{trace(A)+\epsilon}$
三、角点匹配
Harris角点检测仅仅检测出兴趣点位置,然而往往我们进行角点检测的目的是为了进行图像间的兴趣点匹配,我们在每一个兴趣点加入descriptors描述子信息,给出比较描述子信息的方法. Harris角点的,描述子是由周围像素值块batch的灰度值,以及用于比较归一化的相关矩阵构成。
通常,两个大小相同的像素块I_1(x)和I_2(x) 的相关矩阵为:
$$c(I_1,I_2) = \sum_x f(I_1(x),I_2(x))$$
$f函数随着方法变化而变化,c(I_1,I_2)$值越大,像素块相似度越高.
对互相关矩阵进行归一化得到normalized cross correlation :
$$ncc(I_1,I_2) = \frac{1}{n-2} \sum_x \frac{(I_1(x)-\mu_1)}{\sigma_1} \cdot \frac{(I_2(x)-\mu_2)}{\sigma_2}$$
其中$\mu$为像素块的均值,\sigma为标准差. ncc对图像的亮度变化具有更好的稳健性.
四、python实现
python版本:2.7
依赖包: numpy,scipy,PIL, matplotlib
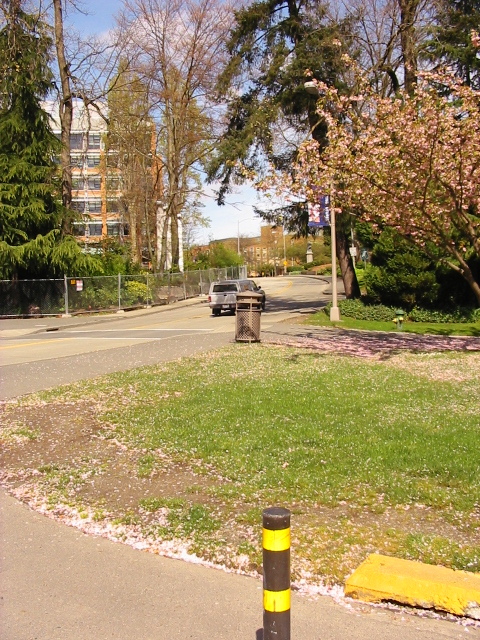
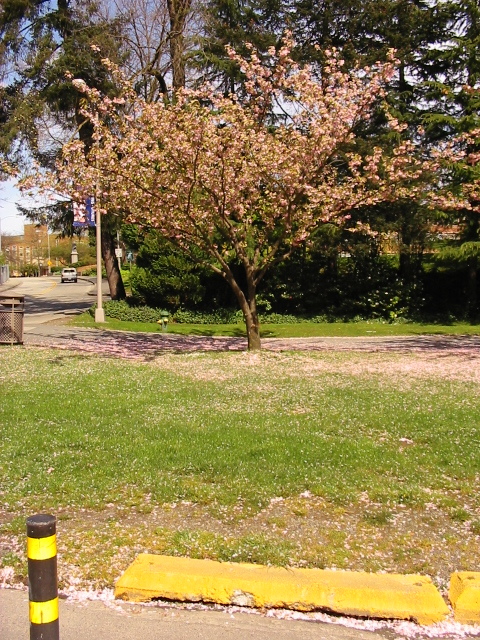
图片:
trees_002.jpg
trees003.jpg
from PIL import Image from scipy.ndimage import filters from numpy import * from pylab import * def compute_harris_response(im,sigma=3): """Compute the Harris corner detector response function for each pixel in a graylevel image.""" #derivative imx = zeros(im.shape) filters.gaussian_filter(im,(sigma,sigma),(0,1),imx) imy = zeros(im.shape) filters.gaussian_filter(im,(sigma,sigma),(1,0),imy) #compute components of the Harris matrix Wxx = filters.gaussian_filter(imx*imx,sigma) Wxy = filters.gaussian_filter(imx*imy,sigma) Wyy = filters.gaussian_filter(imy*imy,sigma) #determinant and trace Wdet = Wxx*Wyy-Wxy**2 Wtr = Wxx+Wyy return Wdet/Wtr def get_harris_points(harrisim,min_dist=10,threshold=0.1): """Return corners from a Harris response image min_dist is the minimum number of pixels separating corners and image boundary.""" #find top corner candidates above a threshold corner_threshold = harrisim.max()*threshold harrisim_t = 1*(harrisim>corner_threshold) #get coordiantes of candidate coords = array(harrisim_t.nonzero()).T #...and their valus candicates_values = [harrisim[c[0],c[1]] for c in coords] #sort candicates index = argsort(candicates_values) #sort allowed point loaction in array allowed_location = zeros(harrisim.shape) allowed_location[min_dist:-min_dist,min_dist:-min_dist] = 1 #select the best points taking min_distance into account filtered_coords = [] for i in index: if allowed_location[coords[i,0],coords[i,1]]==1: filtered_coords.append(coords[i]) allowed_location[(coords[i,0]-min_dist):(coords[i,0]+min_dist), (coords[i,1]-min_dist):(coords[i,1]+min_dist)]=0 return filtered_coords def plot_harris_points(image,filtered_coords): """plots corners found in image.""" figure gray() imshow(image) plot([p[1] for p in filtered_coords],[p[0] for p in filtered_coords],'*') axis('off') show() def get_descriptors(image,filter_coords,wid=5): """For each point return pixel values around the point using a neihborhood of 2*width+1.""" desc=[] for coords in filter_coords: patch = image[coords[0]-wid:coords[0]+wid+1, coords[1]-wid:coords[1]+wid+1].flatten() desc.append(patch) # use append to add new elements return desc def match(desc1,desc2,threshold=0.5): """For each corner point descriptor in the first image, select its match to second image using normalized cross correlation.""" n = len(desc1[0]) #num of harris descriptors #pair-wise distance d = -ones((len(desc1),len(desc2))) for i in range(len(desc1)): for j in range(len(desc2)): d1 = (desc1[i]-mean(desc1[i]))/std(desc1[i]) d2 = (desc2[j]-mean(desc2[j]))/std(desc2[j]) ncc_value = sum(d1*d2)/(n-1) if ncc_value>threshold: d[i,j] = ncc_value ndx = argsort(-d) matchscores = ndx[:,0] return matchscores def match_twosided(desc1,desc2,threshold=0.5): """two sided symmetric version of match().""" matches_12 = match(desc1,desc2,threshold) matches_21 = match(desc2,desc1,threshold) ndx_12 = where(matches_12>=0)[0] print ndx_12.dtype # remove matches that are not symmetric for n in ndx_12: if matches_21[matches_12[n]] !=n: matches_12[n] = -1 return matches_12 def appendimages(im1,im2): """Return a new image that appends that two images side-by-side.""" #select the image with the fewest rows and fill in enough empty rows rows1 = im1.shape[0] rows2 = im2.shape[0] if rows1<rows2: im1 = concatenate((im1,zeros((rows2-rows1,im1.shape[1]))),axis=0) elif rows1<rows2: im2 = concatenate((im2,zeros((rows1-rows2,im2.shape[1]))),axis=0) return concatenate((im1,im2),axis=1) def plot_matches(im1,im2,locs1,locs2,matchscores,show_below=True): """show a figure with lines joinging the accepted matches Input:im1,im2(images as arrays),locs1,locs2,(feature locations), metachscores(as output from 'match()'), show_below(if images should be shown matches).""" im3 = appendimages(im1,im2) if show_below: im3 = vstack((im3,im3)) imshow(im3) cols1 = im1.shape[1] for i,m in enumerate(matchscores): if m>0: plot([locs1[i][1],locs2[m][1]+cols1],[locs1[i][0],locs2[m][0]],'c') axis('off') """ im = array(Image.open('F:/images/lena.bmp').convert('1')) harrisim = compute_harris_response(im) filtered_coords = get_harris_points(harrisim,6) plot_harris_points(im,filtered_coords) """ im1 = array(Image.open('trees_002.jpg').convert('L')) im2 = array(Image.open('trees_003.jpg').convert('L')) wid = 5 harrisim = compute_harris_response(im1,5) filtered_coords1 = get_harris_points(harrisim,wid+1) d1 = get_descriptors(im1,filtered_coords1,wid) harrisim = compute_harris_response(im2,5) filtered_coords2 = get_harris_points(harrisim,wid+1) d2 = get_descriptors(im2,filtered_coords2,wid) print 'starting matching' matches = match_twosided(d1,d2) figure() gray()
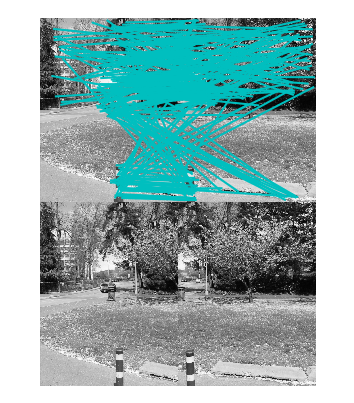
plot_matches(im1,im2,filtered_coords1,filtered_coords2,matches) show()
运行结果:

 浙公网安备 33010602011771号