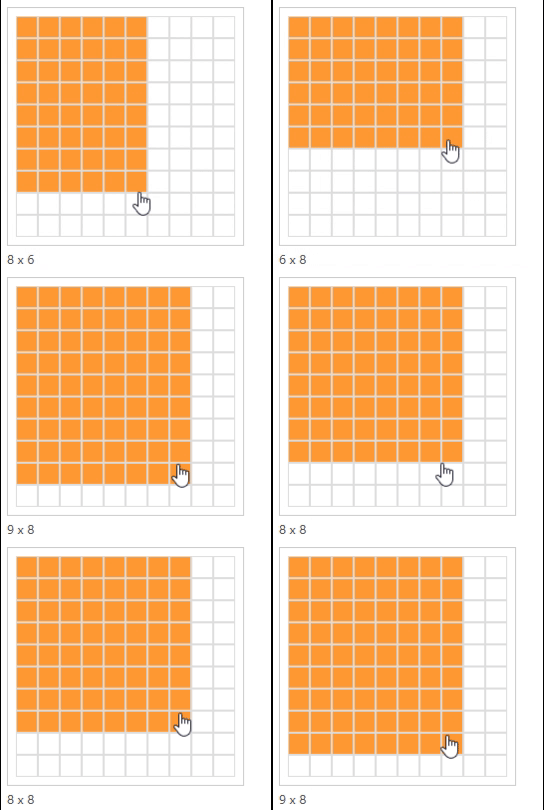
鼠标拖动方式实现动态添加表格样式
下面是效果图

下面是代码
<!DOCTYPE html>
<html lang="zh-CN">

<head>
    <meta charset="UTF-8">
    <title>动态表格选择器</title>
    <style>
        .table-picker {
            display: inline-block;
            padding: 8px;
            border: 1px solid #ccc;
            user-select: none;
        }

        .row {
            display: flex;
        }

        .cell {
            width: 20px;
            height: 20px;
            border: 1px solid #ddd;
            background-color: white;
            cursor: pointer;
        }

        .cell.active {
            background-color: #ff9933;
        }

        .picker-info {
            margin-top: 5px;
            font-size: 12px;
            color: #555;
        }

        .picker-result {
            margin-top: 10px;
            font-weight: bold;
        }
    </style>
</head>

<body>

    <div class="table-picker" id="picker"></div>
    <div class="picker-info" id="info">0 x 0</div>
    <div class="picker-result" id="result"></div>

    <script>
        const maxRows = 10;
        const maxCols = 10;
        const picker = document.getElementById('picker');
        const info = document.getElementById('info');
        const result = document.getElementById('result');

        let hoverRows = 0;
        let hoverCols = 0;

        function createGrid() {
            for (let row = 1; row <= maxRows; row++) {
                const rowDiv = document.createElement('div');
                rowDiv.className = 'row';
                for (let col = 1; col <= maxCols; col++) {
                    const cell = document.createElement('div');
                    cell.className = 'cell';
                    cell.dataset.row = row;
                    cell.dataset.col = col;
                    cell.addEventListener('mouseover', () => setHover(row, col));
                    cell.addEventListener('click', () => select(row, col));
                    rowDiv.appendChild(cell);
                }
                picker.appendChild(rowDiv);
            }
            picker.addEventListener('mouseleave', resetHover);
        }

        function setHover(rows, cols) {
            hoverRows = rows;
            hoverCols = cols;
            updateHighlight();
            info.textContent = `${rows} x ${cols}`;
        }

        function resetHover() {
            hoverRows = 0;
            hoverCols = 0;
            updateHighlight();
            info.textContent = `0 x 0`;
        }

        function updateHighlight() {
            document.querySelectorAll('.cell').forEach(cell => {
                const r = parseInt(cell.dataset.row);
                const c = parseInt(cell.dataset.col);
                cell.classList.toggle('active', r <= hoverRows && c <= hoverCols);
            });
        }

        function select(rows, cols) {
            result.textContent = `选中表格:${rows} 行 × ${cols} 列`;
            console.log(`选择了 ${rows} 行 × ${cols} 列`);
        }

        createGrid();
    </script>

</body>

</html>


 浙公网安备 33010602011771号