

09_图像阈值
import cv2 #opencv的缩写为cv2
import matplotlib.pyplot as plt # matplotlib库用于绘图展示
import numpy as np # numpy数值计算工具包
img = cv2.imread('D:/pycharm/pycharm-cope/opencv/resource/photo/01_cat',cv2.IMREAD_COLOR)
img_gray = cv2.imread('D:/pycharm/pycharm-cope/opencv/resource/photo/01_cat',cv2.IMREAD_GRAYSCALE)
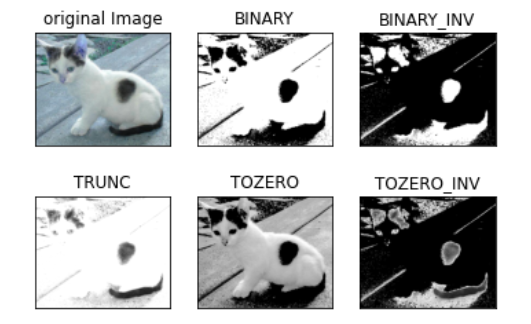
ret, thresh1 = cv2.threshold(img_gray, 127, 255, cv2.THRESH_BINARY)
print(ret)
ret, thresh2 = cv2.threshold(img_gray, 127, 255, cv2.THRESH_BINARY_INV) # THRESH_BINARY_INV 相对 THRESH_BINARY 黑的变成白的,白的变成黑的
print(ret)
ret, thresh3 = cv2.threshold(img_gray, 127, 255, cv2.THRESH_TRUNC)
print(ret)
ret, thresh4 = cv2.threshold(img_gray, 127, 255, cv2.THRESH_TOZERO)
print(ret)
ret, thresh5 = cv2.threshold(img_gray, 127, 255, cv2.THRESH_TOZERO_INV)
print(ret)
titles = ['original Image','BINARY','BINARY_INV','TRUNC','TOZERO','TOZERO_INV']
images = [img, thresh1, thresh2, thresh3, thresh4, thresh5]
for i in range(6):
plt.subplot(2, 3,i+1), plt.imshow(images[i],'gray')
plt.title(titles[i])
plt.xticks([]), plt.yticks([])
plt.show()
结果展示

 浙公网安备 33010602011771号