


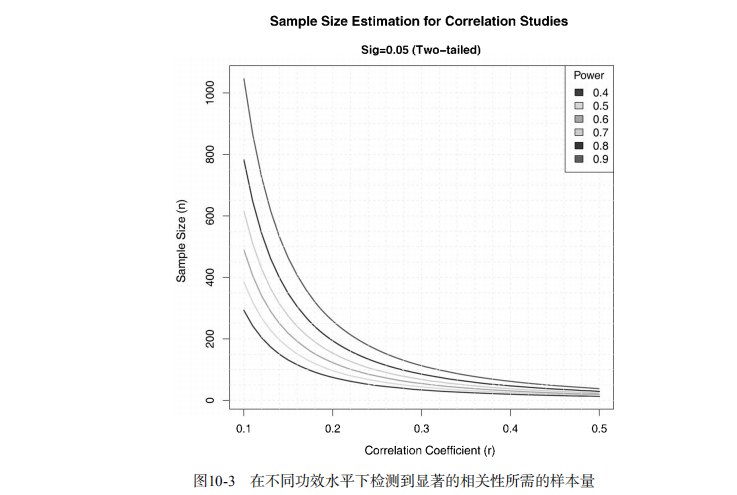

#----------------------------------------#
# R in Action (2nd ed): Chapter 10       #
# Power analysis                         #
# requires packages pwr to be installed  #
# install.packages("pwr")                #
#----------------------------------------#

par(ask=TRUE)

library(pwr)

# t tests
pwr.t.test(d=.8, sig.level=.05,power=.9, type="two.sample",
           alternative="two.sided")
pwr.t.test(n=20, d=.5, sig.level=.01, type="two.sample",
           alternative="two.sided")


# ANOVA
pwr.anova.test(k=5,f=.25,sig.level=.05,power=.8)

# Correlations
pwr.r.test(r=.25, sig.level=.05, power=.90, alternative="greater")

# Linear Models
pwr.f2.test(u=3, f2=0.0769, sig.level=0.05, power=0.90)

# Tests of proportions
pwr.2p.test(h=ES.h(.65, .6), sig.level=.05, power=.9,
            alternative="greater")

# Chi-square tests
prob <- matrix(c(.42, .28, .03, .07, .10, .10), byrow=TRUE, nrow=3)
ES.w2(prob)
pwr.chisq.test(w=.1853, df=3 , sig.level=.05, power=.9)


# Listing 10.1 - Sample sizes for detecting significant effects in a One-Way ANOVA
es <- seq(.1, .5, .01)
nes <- length(es)
samsize <- NULL
for (i in 1:nes){
  result <- pwr.anova.test(k=5, f=es[i], sig.level=.05, power=.9)
  samsize[i] <- ceiling(result$n)
}
plot(samsize,es, type="l", lwd=2, col="red",
     ylab="Effect Size",
     xlab="Sample Size (per cell)",
     main="One Way ANOVA with Power=.90 and Alpha=.05")


# Listing 10.2 - Sample size curves for dtecting corelations of various sizes
library(pwr)
r <- seq(.1,.5,.01)
nr <- length(r)
p <- seq(.4,.9,.1)
np <- length(p)
samsize <- array(numeric(nr*np), dim=c(nr,np))
for (i in 1:np){
  for (j in 1:nr){
    result <- pwr.r.test(n = NULL, r = r[j],
                         sig.level = .05, power = p[i],
                         alternative = "two.sided")
    samsize[j,i] <- ceiling(result$n)
  }
}
xrange <- range(r)
yrange <- round(range(samsize))
colors <- rainbow(length(p))
plot(xrange, yrange, type="n",
     xlab="Correlation Coefficient (r)",
     ylab="Sample Size (n)" )
for (i in 1:np){
  lines(r, samsize[,i], type="l", lwd=2, col=colors[i])
}
abline(v=0, h=seq(0,yrange[2],50), lty=2, col="grey89")
abline(h=0, v=seq(xrange[1],xrange[2],.02), lty=2, col="gray89")
title("Sample Size Estimation for Correlation Studies\n
Sig=0.05 (Two-tailed)")
legend("topright", title="Power", as.character(p),
       fill=colors)
