

Prometheus使用教程
官方文档:https://prometheus.io/docs/prometheus/latest/getting_started/
其他参考:CentOS7安装部署Prometheus+Grafana
1.安装Prometheus
官方网站下载二进制安装包:https://prometheus.io/download/
可以选择mac,linux和Windows版本
https://github.com/prometheus/prometheus/releases/download/v2.36.1/prometheus-2.36.1.linux-amd64.tar.gz
tar -zxvf prometheus-2.36.1.linux-amd64.tar.gz
2.修改prometheus配置
配置文件为prometheus.yml
prometheus采集数据的方法分成推和拉
1.prometheus定时通过exporter暴露的HTTP端口主动去采集监控数据的方式就是拉
下面就是配置一个exporter采集任务的例子
scrape_configs:
  # The job name is added as a label `job=<job_name>` to any timeseries scraped from this config.
  - job_name: "prometheus"

    # metrics_path defaults to '/metrics'
    # scheme defaults to 'http'.

    static_configs:
      - targets: ["xx:xx"]
2.程序主动上报metrics给prometheus的pushgateway则是推
要主动上报metrics首先要安装pushgateway,参考:prometheus-pushgateway安装
在官方的文档当中,pushgateway唯一推荐使用的场景是在批处理作业运行结果的采集上,其他的建议使用exporter:when-to-use-the-pushgateway
官方地址
https://prometheus.io/download/#pushgateway/
下载和安装
wget https://github.com/prometheus/pushgateway/releases/download/v1.4.3/pushgateway-1.4.3.linux-amd64.tar.gz
tar -zxvf pushgateway-1.4.3.linux-amd64.tar.gz
启动
./pushgateway
然后在prometheus的配置文件中添加pushgateway,注意:需要把pushgateway添加到prometheus的配置中并启动,pushgateway才会正常工作
-job_name: 'pushgateway'
    scrape_interval: 30s
    honor_labels: true  #加上此配置exporter节点上传数据中的一些标签将不会被pushgateway节点的相同标签覆盖
    static_configs:
      - targets: ['localhost:9091']
        labels:
          instance: pushgateway
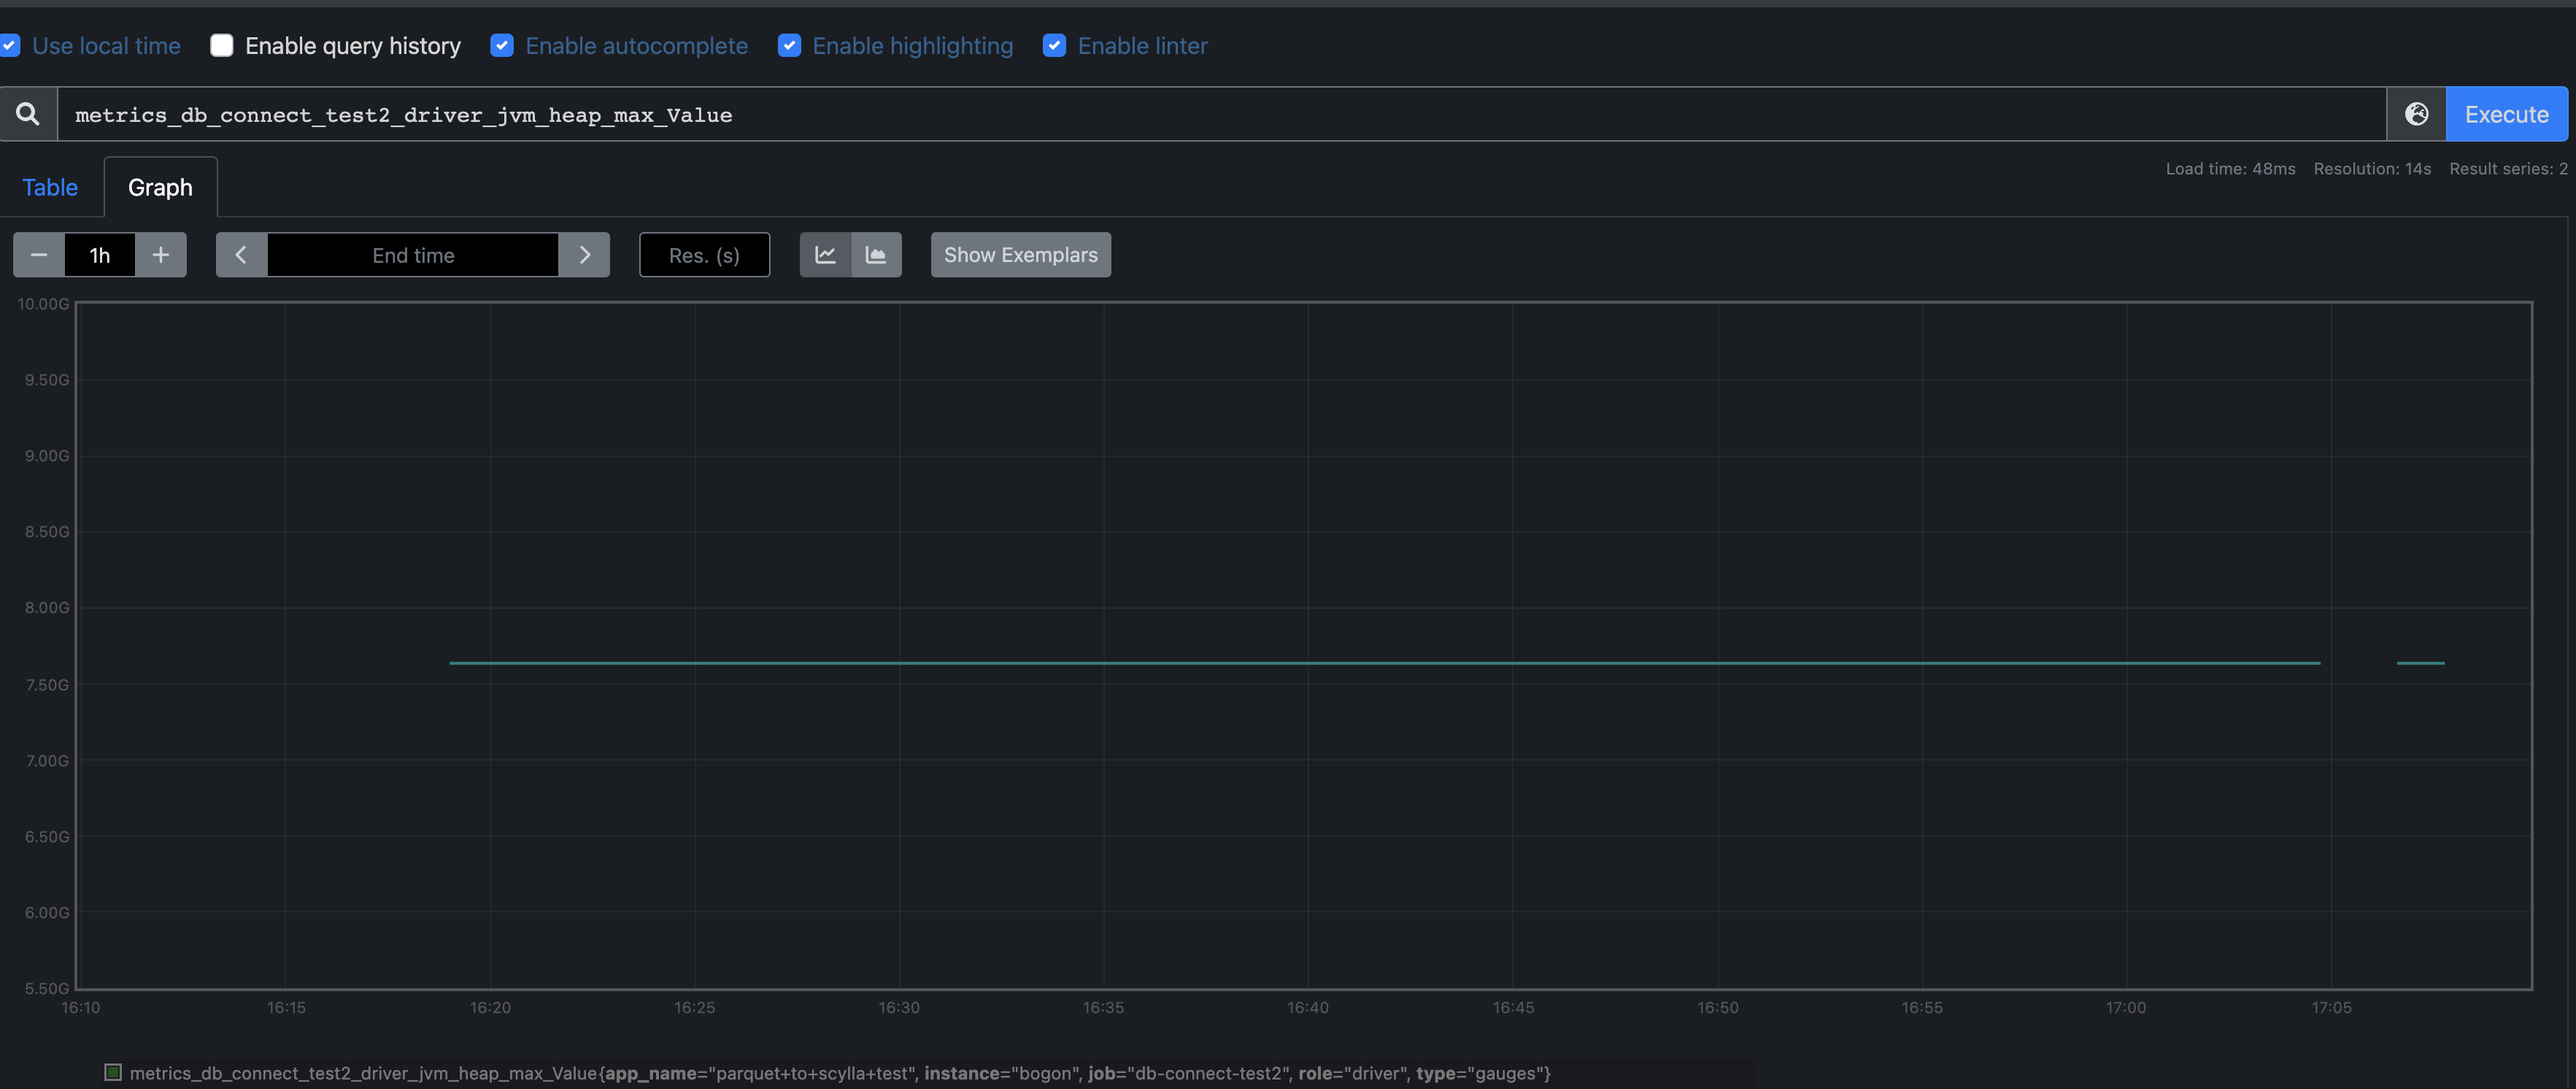
原生的pushgateway会存储最后上报的指标,不会进行删除,当prometheus过来取数据的时候,会默认取最后上报的数据,也就是即使不上报指标了,在图上也会一直有一条直线存在
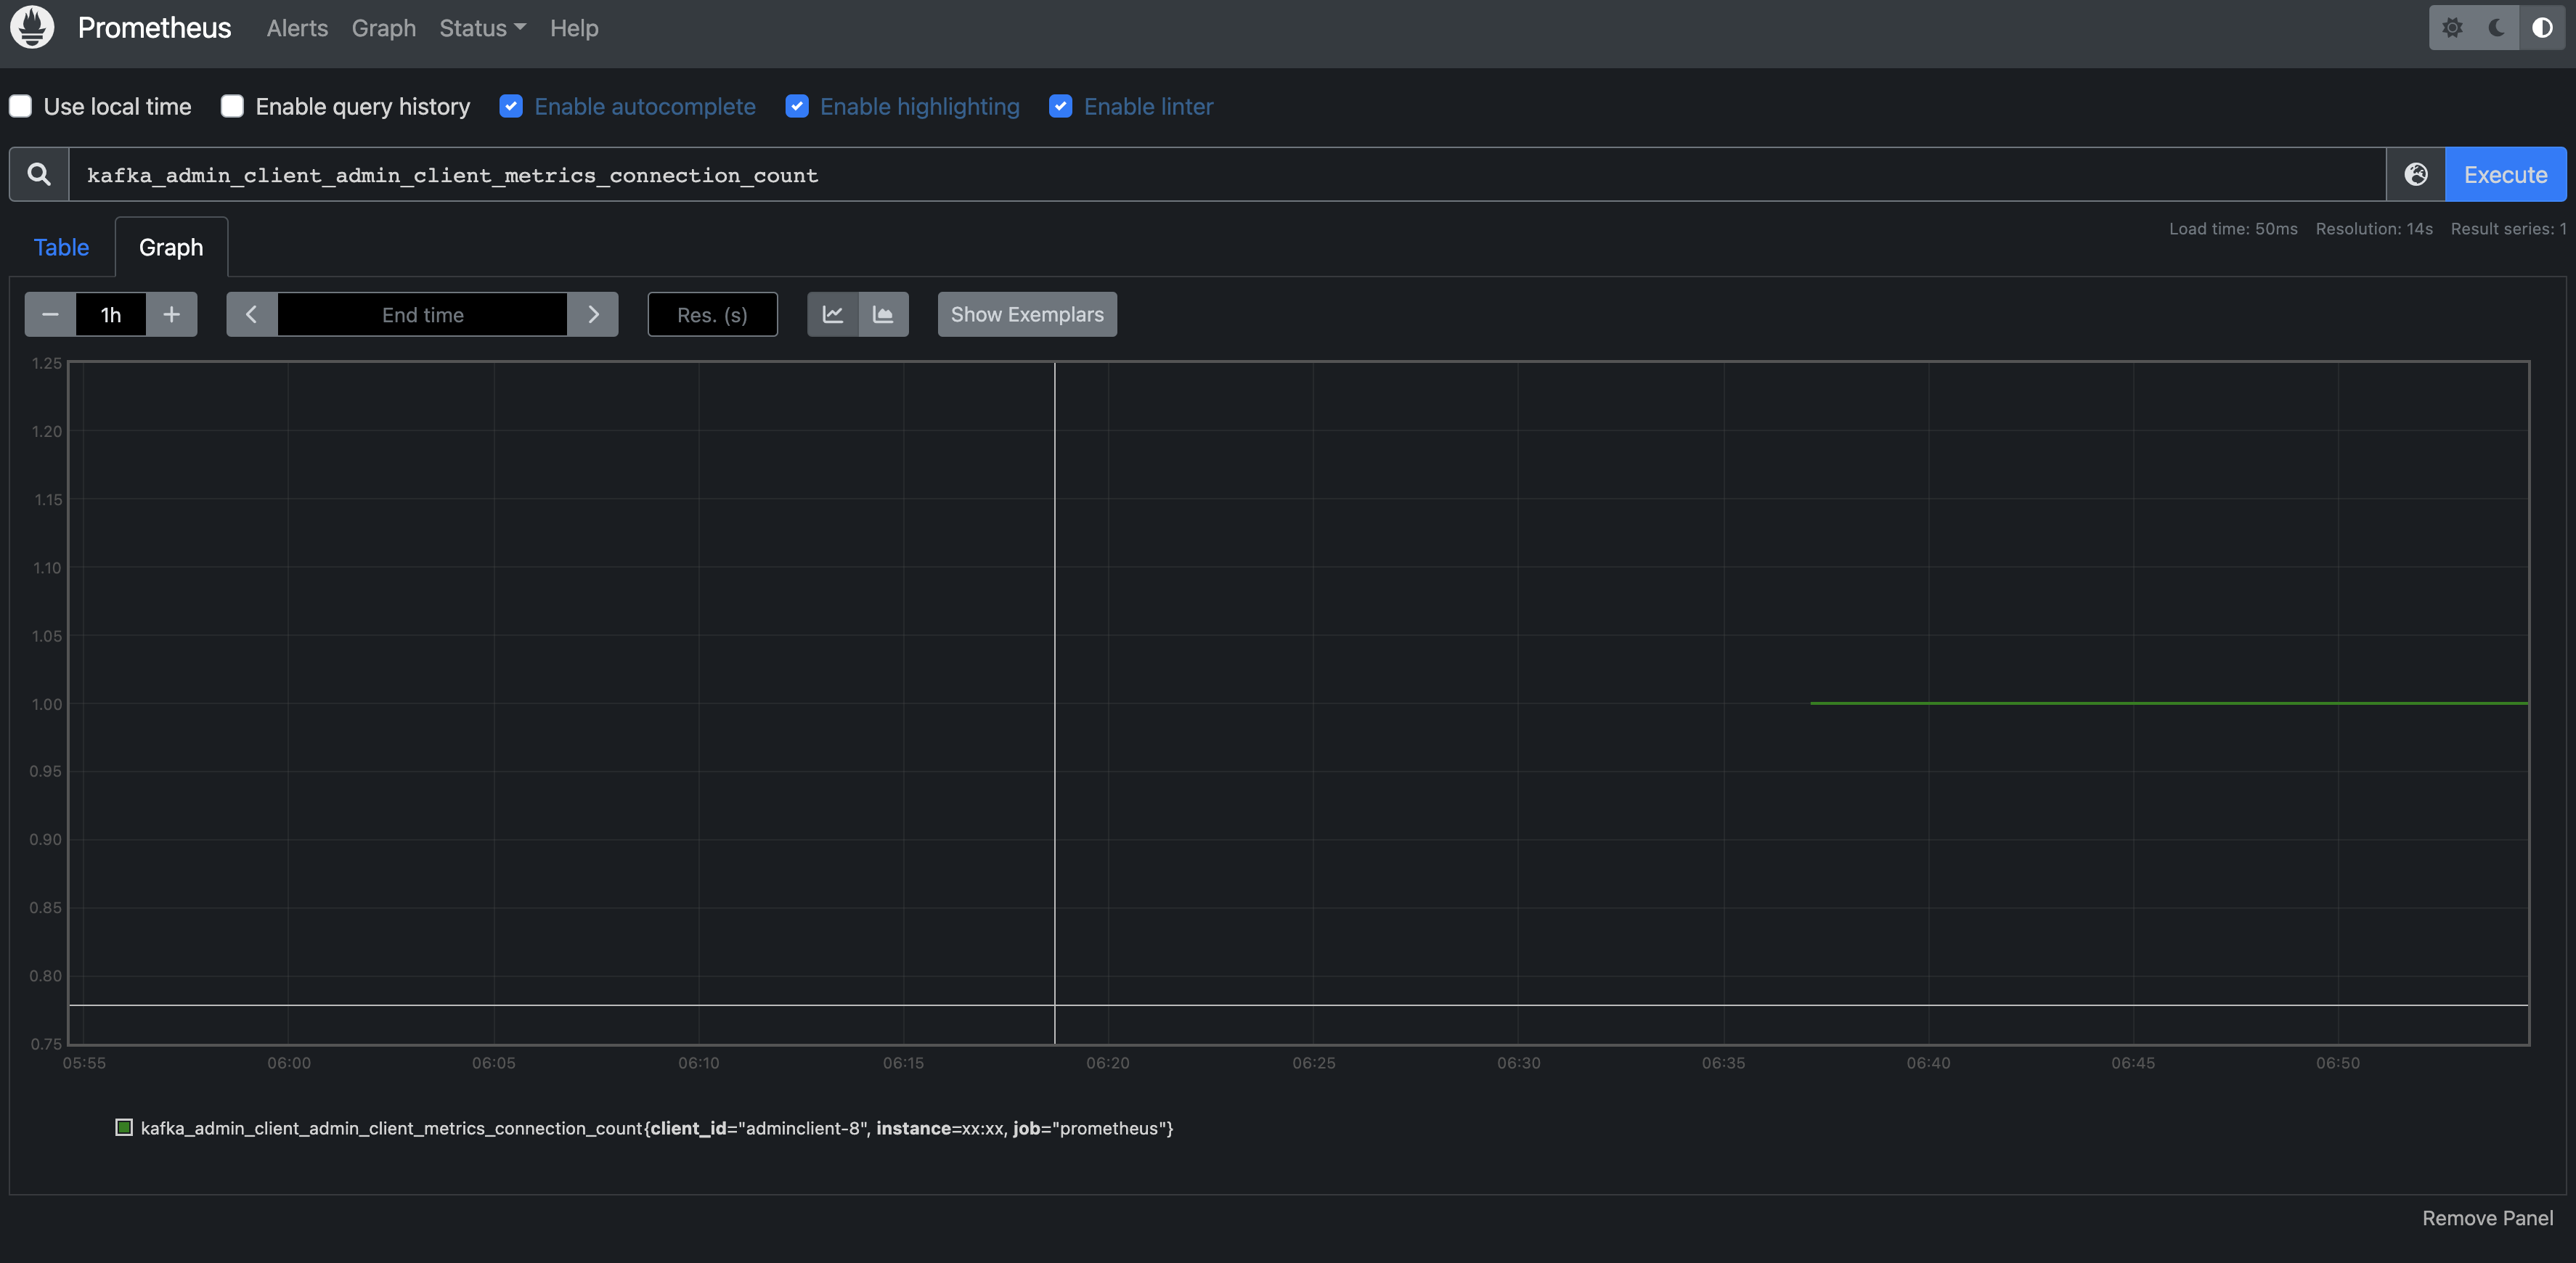
如果要支持pushgateway数据自动过期的话,可以使用下面的pushgateway镜像
docker run -d -p 9091:9091 dmathai/prom-pushgateway-ttl:latest --metric.timetolive=60s
效果如下,如果不上报,过了60s,数据就会中断
也可以使用curl命令上报指标
echo "logic_cpu 5" |curl --data-binary @- http://xx:9091/metrics/job/my_test_job/role/driver/app_name/my+test+job/instance/xxxdeMacBook-Pro.local
3.启动Prometheus
./prometheus --config.file=prometheus.yml
其默认的存储目录在data目录下
/Users/lintong/software/prometheus-2.36.1.darwin-amd64/data $ ls
chunks_head    lock           queries.active wal
如果要修改的话,可以添加如下配置
./prometheus --config.file=prometheus.yml --storage.tsdb.path=/data/prometheus
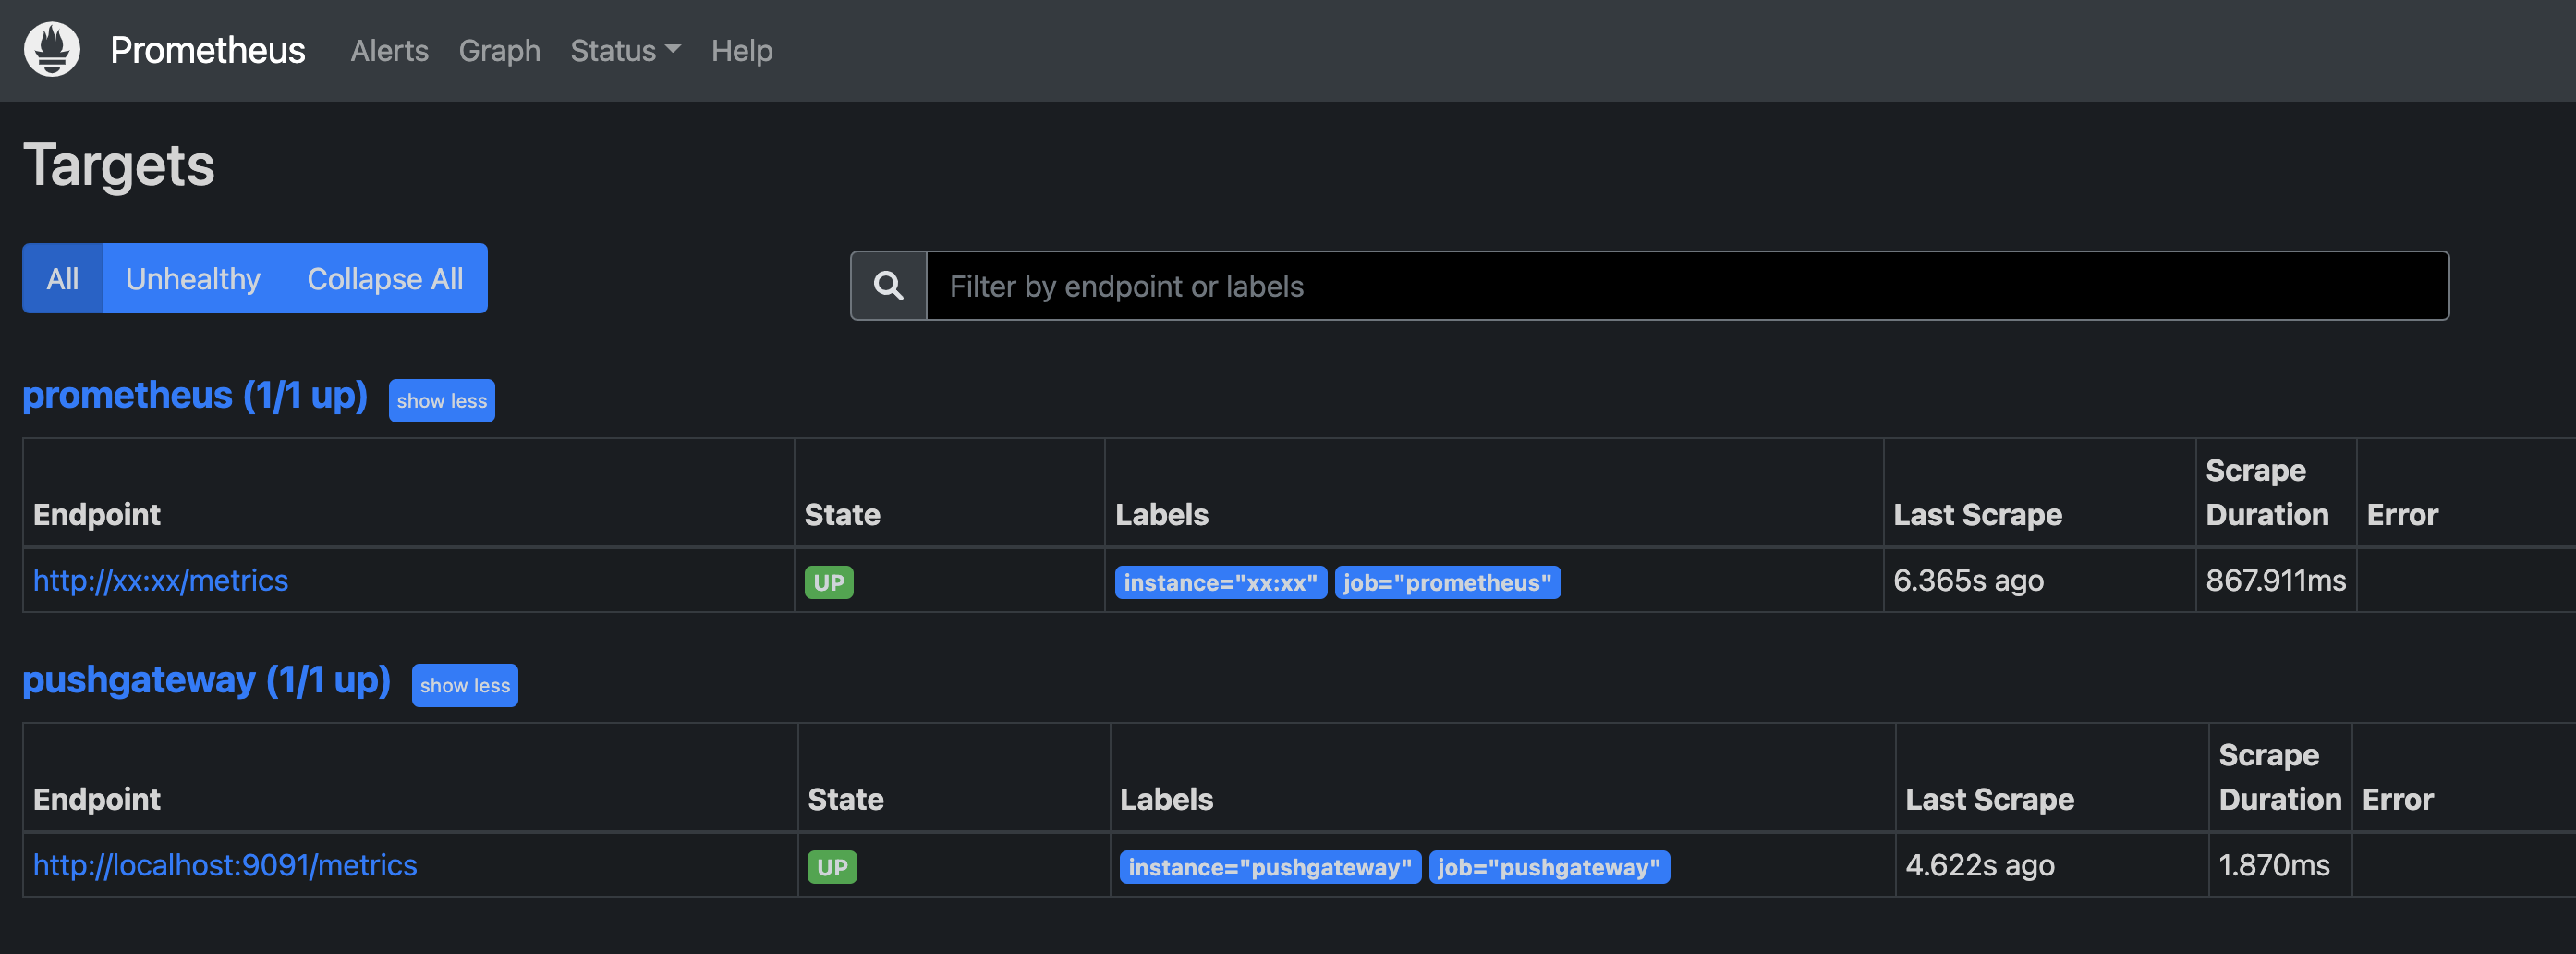
之后访问9090端口就可以查看dashboar,启动instance和job是配置文件中采集的exporter的地址和名字
也可以在target中看到添加的exporter
本文只发表于博客园和tonglin0325的博客,作者:tonglin0325,转载请注明原文链接:https://www.cnblogs.com/tonglin0325/p/5277090.html

 浙公网安备 33010602011771号