
第二篇[机器学习] 学习机器学习,从最简单的线性回归开始
机器学习,分为监督学习和无监督学习,监督学习里有回归和分类,分类有线性回归和逻辑回归。
从最简单的线性回归开始:
通过已有数据需要预测的线性方程:

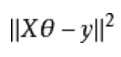
实际值和预测值的误差,求最小误差函数(最小二乘法):
1.梯度下降法:
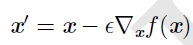
其中ε是步长,步长越大,下降越快,但是可能到不了局部最小值,步长越小,下降越慢,计算越多
2.正规方程直接求解:
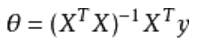
最小二乘法正规方程组的详细推导:
https://zhuanlan.zhihu.com/p/28190949?utm_medium=social&utm_source=wechat_session
scikit-learn的线性回归代码,参考网页:
input:
# Code source: Jaques Grobler
# License: BSD 3 clause


import matplotlib.pyplot as plt
import numpy as np
from sklearn import datasets, linear_model
from sklearn.metrics import mean_squared_error, r2_score

# Load the diabetes dataset
diabetes = datasets.load_diabetes()


# Use only one feature
diabetes_X = diabetes.data[:, np.newaxis, 2]

# Split the data into training/testing sets
diabetes_X_train = diabetes_X[:-20]
diabetes_X_test = diabetes_X[-20:]

# Split the targets into training/testing sets
diabetes_y_train = diabetes.target[:-20]
diabetes_y_test = diabetes.target[-20:]

# Create linear regression object
regr = linear_model.LinearRegression()

# Train the model using the training sets
regr.fit(diabetes_X_train, diabetes_y_train)

# Make predictions using the testing set
diabetes_y_pred = regr.predict(diabetes_X_test)

# The coefficients
print('Coefficients: \n', regr.coef_)
# The mean squared error
print("Mean squared error: %.2f"
      % mean_squared_error(diabetes_y_test, diabetes_y_pred))
# Explained variance score: 1 is perfect prediction
print('Variance score: %.2f' % r2_score(diabetes_y_test, diabetes_y_pred))

# Plot outputs
plt.scatter(diabetes_X_test, diabetes_y_test,  color='black')
plt.plot(diabetes_X_test, diabetes_y_pred, color='blue', linewidth=3)

plt.xticks(())
plt.yticks(())

plt.show()
output:
Coefficients:
 [ 938.23786125]
Mean squared error: 2548.07
Variance score: 0.47
在这里,分别将diabetes_X_train和diabetes_y_train带入线性回归算法里拟合,求出了系数矩阵,并输出了均方误差和方差
怎么理解这里的系数,均方误差(MSE),方差?
coefficient,即系数矩阵
方差很简单,数据与平均数之差平方和的平均数
标准差是方差的平方根偏差,个别数据与平均值之差
均方误差,包含偏差和方差
偏差和方差的关系和机器学习容量,欠拟合和过拟合的概念联系比较紧密。
一般来说,偏差较大很可能欠拟合,方差较大可能过拟合。
在这里,我们使用的是最简单的线性回归模型,而且没有考虑怎么优化,没有考虑把数据进行分组进行交叉验证。
接下来,我会用这个模型分析kaggle上面的titanic数据,当然,结果肯定是很不好的,但是,重点是掌握这个方法,之后再考虑选择和优化。

 浙公网安备 33010602011771号