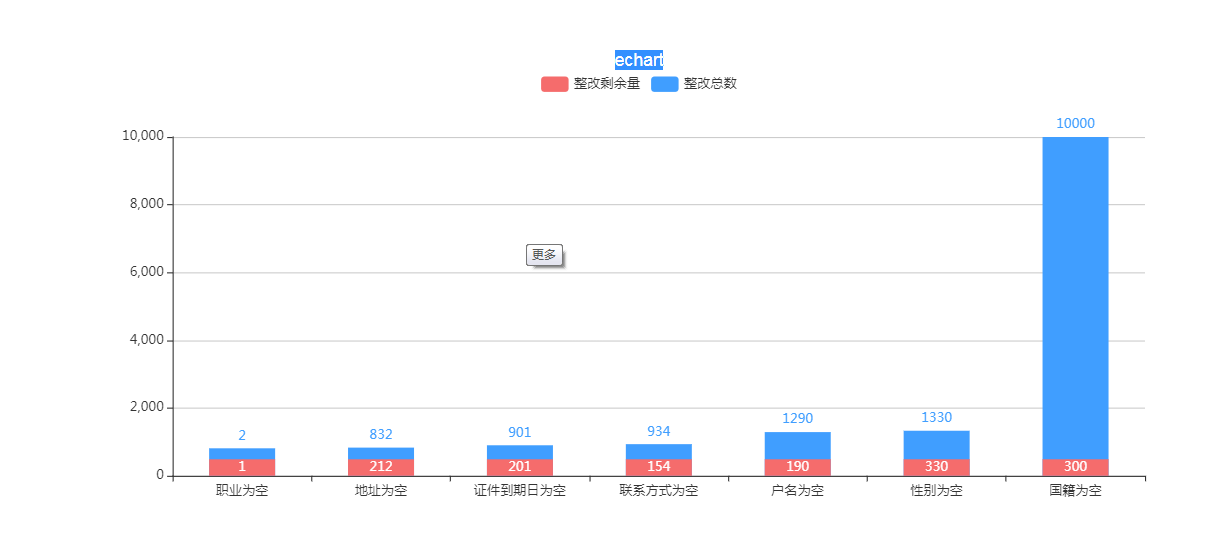
说明:stack相同,两个bar合并但是不会重叠
  如果需要重叠 用barGap: '-100%', 根据不同的需求来使用两者。
<template>
  <div>
    echart
    <div id="id" style="width: 1000px;height:400px;margin:0 auto;">

    </div>
  </div>
</template>

<script>
import Vue  from 'vue'
import echarts from 'echarts'
export default {
  name: 'echart',
  data () {
    return {

    }
  },
  methods: {
      echart(){
            let myChart = echarts.init(document.getElementById('id'));
          let option = {
    tooltip : {
        trigger: 'axis',
        axisPointer : {            // 坐标轴指示器,坐标轴触发有效
            type : 'shadow'        // 默认为直线,可选为:'line' | 'shadow'
        }
    },
    legend: {
        data: ['整改剩余量', '整改总数']
    },
    grid: {
        left: '3%',
        right: '4%',
        bottom: '3%',
        containLabel: true
    },
    yAxis:  {
        type: 'value'
    },
    xAxis: {
        type: 'category',
        data: ['职业为空','地址为空','证件到期日为空','联系方式为空','户名为空','性别为空','国籍为空']
    },
    series: [

        {
            name: '整改剩余量',
            type: 'bar',
            // stack: '1',
             barGap: '-100%',
             z: 10,
            barWidth:60,
            barMinHeight:15,
            color:'#F56C6C',
            label: {
                normal: {
                    show: true,
                    position: 'inside',
                }
            },
            data: [1, 212, 201, 154, 190, 330, 300]
        },
        {
            name: '整改总数',
            type: 'bar',
            barWidth:60,
            // stack: '1',
            barMinHeight:25,
            color:'#409EFF',
            label: {
                normal: {
                    show: true,
                    position: 'top'
                }
            },
            data: [2, 832, 901, 934, 1290, 1330, 10000]
        }
    ]
};
        myChart.setOption(option);
        }
    },
    mounted() {
         this.echart()
    },

}

</script>

<!-- Add "scoped" attribute to limit CSS to this component only -->
<style scoped>


</style>
![]()


 浙公网安备 33010602011771号