【Python】可视化Python库的依赖关系
主要用了两个库:pipdeptree和pyecharts。
pipdeptree用来解析所有库的依赖关系。
pyecharts用来显示依赖的网络关系。
通常的方法应该是通过输入下面命令:
pipdeptree --json-tree > pkg.json
得到关系树文件,然后解析该文件并在pyecharts显示即可。
不过我不想解析json文件了。
这里是直接输入pipdeptree命令,得到控制台输出,然后解析字符串来做的,比较暴力。
ubuntu22.04系统(不同系统好像不一样)控制台输出为下面这种格式:
apturl==0.5.2
autopep8==2.0.2
├── pycodestyle [required: >=2.10.0, installed: 2.10.0]
└── tomli [required: Any, installed: 2.0.1]
bcrypt==3.2.0
blendmodes==2022
├── aenum [required: >=3.1.7,<4, installed: 3.1.12]
├── deprecation [required: >=2.1.0,<3, installed: 2.1.0]
│   └── packaging [required: Any, installed: 23.0]
├── numpy [required: >=1.22.1,<2, installed: 1.24.1]
└── Pillow [required: >=9.0.0,<10, installed: 9.0.1]
发现根据字符串中的"─"字符和该字符所在的位置,就能知道该库是根节点还是被第几层依赖的节点。
然后需要确定前后库的依赖连接,确定的方法也比较暴力,最后转为pyecharts输出即可。
代码如下:
from pyecharts.charts import Graph
from pyecharts import options as opts
import subprocess

# 调用系统命令并获取结果 pip install pipdeptree
result = subprocess.run('pipdeptree', capture_output=True, text=True)
output = result.stdout
output = output.split('\n')

depIndex = []
depName = []

for v in output:
    num = v.find('──')
    if num==-1:
        depIndex.append(0)
        name = v.split('==')
        depName.append(name[0])
    else:
        depIndex.append(num//4+1)
        name = v.split('──')
        name = name[1].split(' ')
        depName.append(name[1])

depIndex.pop()
depName.pop()
maxId = max(depIndex)

nodeNames =list(set(depName))

dicts={}
for nodeName in nodeNames:
    dicts[nodeName] = 5

links = []
while maxId!=0:
    findMax = False
    for i in range(len(depIndex)):
        if i!=0:
            if depIndex[i]==maxId:
                link = {"source":depName[i-1],"target":depName[i]}

                if link not in links:
                    dicts[depName[i]] = dicts[depName[i]] + 2

                links.append(link)
                depIndex.pop(i)
                depName.pop(i)
                findMax = True
                break
    if findMax==False:
        maxId= maxId-1

nodes = []
for nodeName in nodeNames:
    node = {"name":nodeName,"symbolSize":dicts[nodeName]}
    nodes.append(node)

graph = Graph(init_opts=opts.InitOpts(width="1920px", height="1080px"))
graph.add("", nodes, links)
graph.render('show.html')
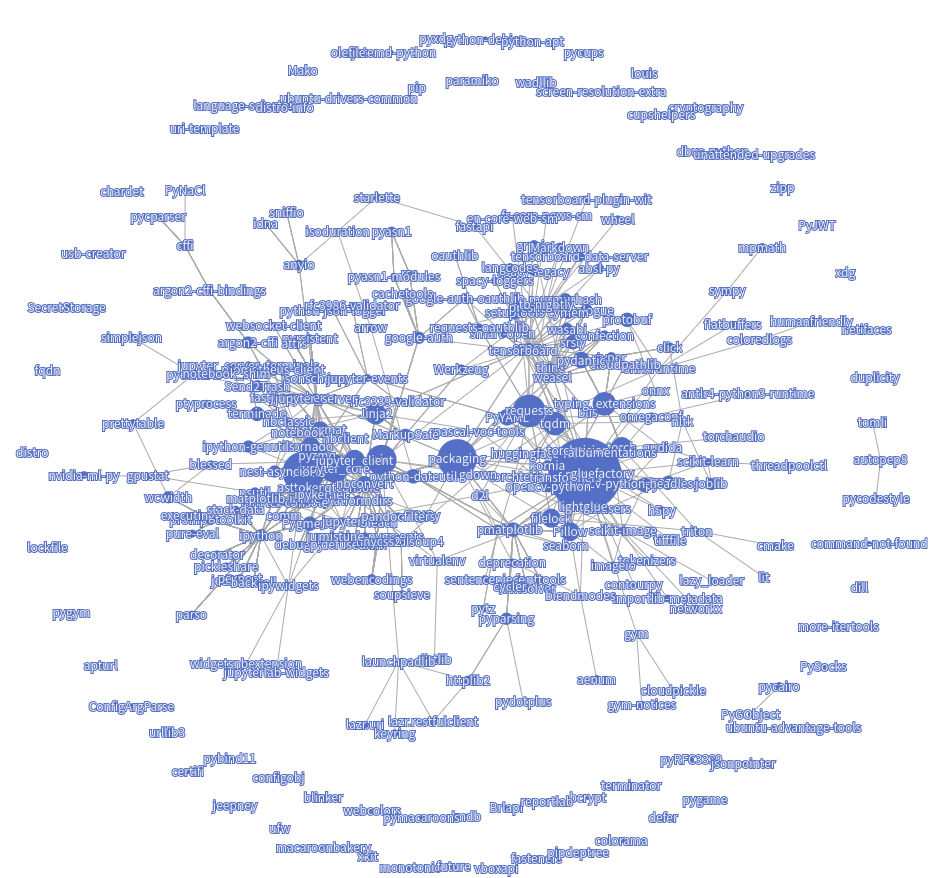
所有连接效果如下,球越大代表被依赖的越多:
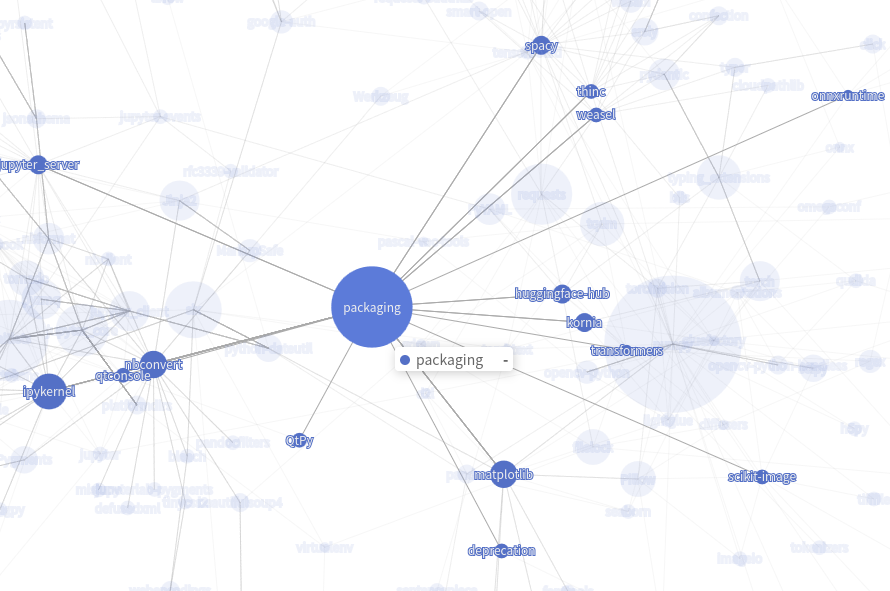
局部效果如下,选中节点后相关节点高亮:

 浙公网安备 33010602011771号