
Flask+MySQL+Echarts: 实现数据可视化
Flask+MySQL+Echarts: 实现数据可视化
版权声明:本文为博主原创文章,遵循 CC 4.0 BY-SA 版权协议,转载请附上原文出处链接和本声明。
一、软件及对应版本
- Python 3.6.1 |Anaconda custom
- Flask 0.12.2
- Echarts 4.0
二、项目目录

三、代码展示
from flask import Flask,render_template, url_for
import pymysql
import pandas as pd


app = Flask(__name__)
app.jinja_env.filters['zip'] = zip

def conn_db():
    conn = pymysql.connect(host="your_host", user="your_username", password="your_password", db="your_database", charset="utf8")
    return conn

def get_data(conn=conn_db(), n=10):
    # Get the top10 products
    sql = "select ProductMName, date_format(FeedbackDate, '%Y-%m') Month, count(FeedBack) Count from Feedbacks group by ProductMName, Month order by Count desc, Month asc"
    df = pd.read_sql(sql, conn)
    conn.close()
    product_count = []
    for index, value in enumerate(df["ProductMName"].unique()):
        product_count.append([value, index+1])
    product_count = dict(product_count)
    df["Rank"] = df["ProductMName"].map(lambda x: product_count[x])
    df = df[df["Rank"]<=n][["ProductMName", "Month", "Count"]]
    df.sort_values(by="Month", inplace=True)
    df_TotleCount = df.groupby(["ProductMName"])["Count"].sum()
    df_TotleCount.sort_values(ascending=False, inplace=True)
    df_pivot = pd.pivot_table(df, index="ProductMName", columns="Month", values="Count", fill_value=0)
    return df_TotleCount, df_pivot

@app.route('/')
def display_FeedbackCountByProject():
    df_TotleCount, df_pivot = get_data(n=10)
    TotleCount = df_TotleCount.values
    ProductMName = df_pivot.index.tolist()
    Month = df_pivot.columns.tolist()
    Count = df_pivot.values.tolist()
    return render_template('FeedbackCountByProject.html', ProductMName=ProductMName, Month=Month, Count=Count, TotleCount=TotleCount)

if __name__ == "__main__":
app.run(debug = True)- 1
- 2
- 3
- 4
- 5
- 6
- 7
- 8
- 9
- 10
- 11
- 12
- 13
- 14
- 15
- 16
- 17
- 18
- 19
- 20
- 21
- 22
- 23
- 24
- 25
- 26
- 27
- 28
- 29
- 30
- 31
- 32
- 33
- 34
- 35
- 36
- 37
- 38
- 39
- 40
- FeedbackCountByProject.html
<!DOCTYPE html>
<html>
<head>
<meta charset="UTF-8">
<script src="{{ url_for('static', filename='echarts.min.js') }}"></script>
<title></title>
<style>
*{
margin: 0; padding: 0;
}
</style>
</head>
<body>
<div id="top" style="width: 1200px; height: 400px; padding: 20px;"></div>
<div id="bottom" style="width: 1200px; height: 400px; padding: 20px;"></div>
<script type="text/javascript">
var myTop = echarts.init(document.getElementById('top'));
var myBottom = echarts.init(document.getElementById('bottom'));
optionTop = {
title: {
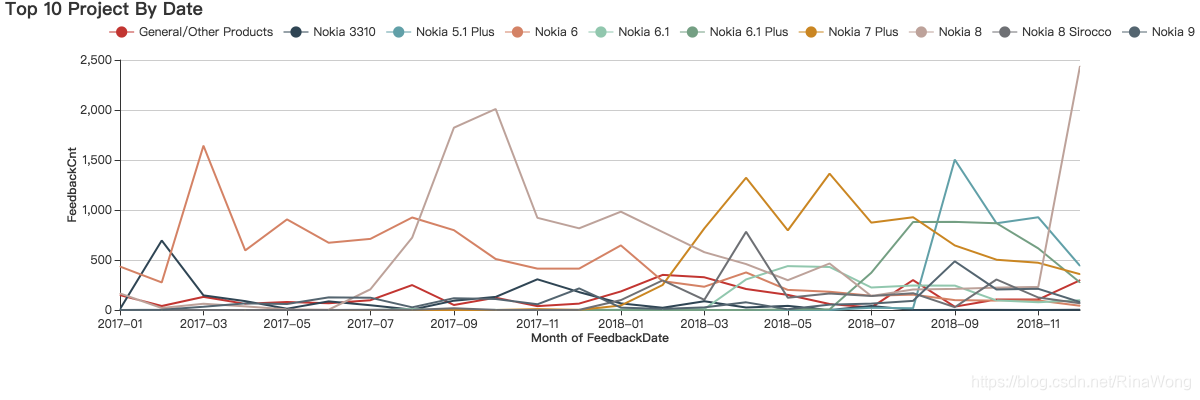
text: 'Top 10 Project By Date',
left: 0,
top: -5,
subtextStyle: {
fontWeight: 'bolder'
},
},
toolbox: {
show: true,
right: 80,
feature: {
saveAsImage: {}
}
},
legend: {
show: true,
data: ['', '', {% for p in ProductMName %}'{{ p }}', {% endfor %}],
right: 0
},
tooltip: {
trigger: 'axis'
},
grid: {
bottom: 90
},
xAxis: {
type: 'category',
boundaryGap: false,
name: 'Month of FeedbackDate',
nameLocation: 'center',
nameGap: 22,
data: [{% for m in Month %}'{{ m }}', {% endfor %}],
silent: false,
splitLine: {
show: false
},
splitArea: {
show: false
},
nameTextStyle: {
fontWeight: 'bolder'
}
},
yAxis: {
type: 'value',
name: 'FeedbackCnt',
nameLocation: 'center',
nameGap: 42,
splitArea: {
show: false
},
nameTextStyle: {
fontWeight: 'bolder'
}
},
series: [
{% for pr, cnt in ProductMName|zip(Count) %}{
name: '{{ pr }}',
type: 'line',
data: {{ cnt }},
symbol: 'circle',
symbolSize: 1
}, {% endfor %}
]
};
optionBottom = {
title: {
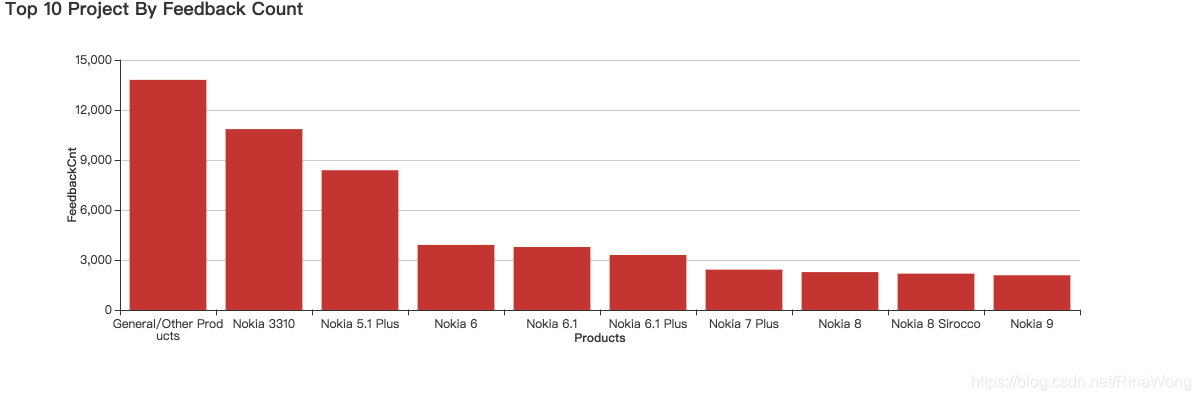
text: 'Top 10 Project By Feedback Count',
left: 0,
top: -5,
subtextStyle: {
fontWeight: 'bolder'
},
},
toolbox: {
show: true,
feature: {
saveAsImage: {}
}
},
legend: {
show: false
},
tooltip: {
trigger: 'axis'
},
grid: {
bottom: 90
},
xAxis: {
type: 'category',
data: [{% for p in ProductMName %}'{{ p }}', {% endfor %}],
name: 'Products',
nameLocation: 'center',
nameGap: 22,
silent: false,
splitLine: {
show: false
},
splitArea: {
show: false
},
nameTextStyle: {
fontWeight: 'bolder'
},
axisLabel: {
interval: 0,
formatter:function(value){
var ret = "";
var maxLength = 18;
var valLength = value.length;
var rowN = Math.ceil(valLength / maxLength);
if (rowN > 1)
{
for (var i=0; i<rowN; i++){
var temp = "";
var start = i * maxLength;
var end = start + maxLength;
temp = value.substring(start, end) + "\n";
ret += temp;
}
return ret;
}else{
return value;
}
}
}
},
yAxis: {
type: 'value',
name: 'FeedbackCnt',
nameLocation: 'center',
nameGap: 42,
splitArea: {
show: false
},
nameTextStyle: {
fontWeight: 'bolder'
}
},
series: [
{
type: 'bar',
data: [{% for tcnt in TotleCount %}{{ tcnt }}, {% endfor %}]
}
]
};
myTop.setOption(optionTop);
myBottom.setOption(optionBottom);
</script>
</body>
</html>- 1
- 2
- 3
- 4
- 5
- 6
- 7
- 8
- 9
- 10
- 11
- 12
- 13
- 14
- 15
- 16
- 17
- 18
- 19
- 20
- 21
- 22
- 23
- 24
- 25
- 26
- 27
- 28
- 29
- 30
- 31
- 32
- 33
- 34
- 35
- 36
- 37
- 38
- 39
- 40
- 41
- 42
- 43
- 44
- 45
- 46
- 47
- 48
- 49
- 50
- 51
- 52
- 53
- 54
- 55
- 56
- 57
- 58
- 59
- 60
- 61
- 62
- 63
- 64
- 65
- 66
- 67
- 68
- 69
- 70
- 71
- 72
- 73
- 74
- 75
- 76
- 77
- 78
- 79
- 80
- 81
- 82
- 83
- 84
- 85
- 86
- 87
- 88
- 89
- 90
- 91
- 92
- 93
- 94
- 95
- 96
- 97
- 98
- 99
- 100
- 101
- 102
- 103
- 104
- 105
- 106
- 107
- 108
- 109
- 110
- 111
- 112
- 113
- 114
- 115
- 116
- 117
- 118
- 119
- 120
- 121
- 122
- 123
- 124
- 125
- 126
- 127
- 128
- 129
- 130
- 131
- 132
- 133
- 134
- 135
- 136
- 137
- 138
- 139
- 140
- 141
- 142
- 143
- 144
- 145
- 146
- 147
- 148
- 149
- 150
- 151
- 152
- 153
- 154
- 155
- 156
- 157
- 158
- 159
- 160
- 161
- 162
- 163
- 164
- 165
- 166
- 167
- 168
- 169
- 170
- 171
- 172
- 173
- 174
- 175
- 176

 浙公网安备 33010602011771号