同一页面多个echarts自适应窗口
项目采用layui+echart
需求:在PC和笔记本下调整窗口大小echarts图形可以自适应。
/**
* 初始化项目得分排名
*/
function initThisMonthProjectsRanking() {
$.ajax({
url: '',
type: 'get',
data: {
deptId: '4676',
page: 1,
limit: 10
},
success: function (res) {
// let dataOption = res
let styleOption = {
grid: {
left: 25 * sceenRate,
right: 15 * sceenRate,
top: 15 * sceenRate,
bottom: 15 * sceenRate
},
xAxis: {
type: 'category',
axisTick: {
show: false
},
nameTextStyle: {
color: '#a4d1ec'
},
axisLine: {
show: true,
lineStyle: {
color: '#319cc9'
}
}
},
yAxis: {
type: 'value',
axisTick: {
show: false
},
nameLocation: 'end',
axisLabel: {
},
axisLine: {
show: false,
lineStyle: {
color: '#319cc9'
}
},
max: 1000,
splitLine: {
show: true,
lineStyle: {
color: '#092e5e',
type: 'dashed'
}
}
},
series: [{
name: 'score',
type: 'bar',
barWidth: 10 * sceenRate,
itemStyle: {
color: new echarts.graphic.LinearGradient(
0, 0, 0, 1,
[
{ offset: 0, color: '#1bd3e0' },
{ offset: 0.5, color: '#2f99c9' },
{ offset: 1, color: '#4264b4' }
]
),
shadowBlur: 5 * sceenRate,
shadowColor: 'rgba(0, 0, 0, 0.5)'
},
emphasis: {
itemStyle: {
color: new echarts.graphic.LinearGradient(
0, 0, 0, 1,
[
{ offset: 0, color: '#4264b4' },
{ offset: 0.7, color: '#4264b4' },
{ offset: 1, color: '#1bd3e0' }
]
)
}
}
}]
}
let id = 'rankingChart'
return initCharts(id, dataOption, styleOption)
},
})
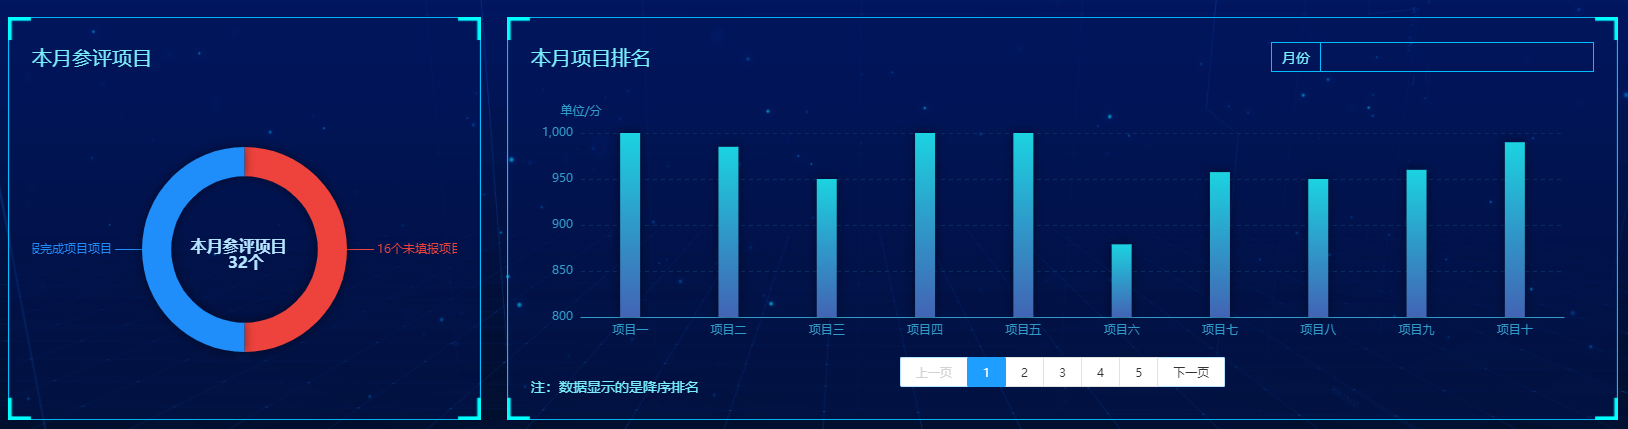
let dataOption = {
xAxis: {
data: ['项目一', '项目二', '项目三', '项目四', '项目五', '项目六', '项目七', '项目八', '项目九', '项目十']
},
yAxis: {
min: 800,
name: '单位/分',
splitNumber: 4
},
series: [{
name: 'score',
type: 'bar',
data: [1000, 985, 950, 1000, 1000, 879, 957.5, 950, 960, 990]
}]
}
}
/**
 * 初始化ECharts图表
 * @param {*} id
 * @param {*} dataOption
 * @param {*} styleOption
 */
function initCharts(id, dataOption, styleOption) {
    var chart = echarts.init(document.getElementById(id))
    chart.setOption(dataOption)
    chart.setOption(styleOption)

    window.addEventListener("resize",function(){
        chart.resize();
    });
    return chart
}

 浙公网安备 33010602011771号