
一、编程环境
编译器:pycharm2017
版本:python3.6
二、程序分析
1、读文件到缓冲区
def process_file(dst):     # 读文件到缓冲区
    try:     # 打开文件
        f=open(dst,'r')
    except IOError as s:
        print(s)
        return None
    try:     # 读文件到缓冲区
        bvffer=f.read()
    except:
        print("Read File Error!")
        return None
    f.close()
    return bvffer

 2、处理缓冲区 bvffer代码,统计每个单词的频率,存放在字典word_freq
def process_buffer(bvffer):
if bvffer:
word_freq = {}
# 下面添加处理缓冲区 bvffer代码,统计每个单词的频率,存放在字典word_freq
bvffer=bvffer.lower() #大小写转换,将大写字母转化为小写字母
for s in '“”!?,.;:$':
bvffer=bvffer.replace(s,' ') #将找出的特殊符替换为空格
list=bvffer.split() #以空格为标志分割字符串
for str in list:
word_freq[str] = word_freq.get(str, 0) + 1 #计数
return word_freq
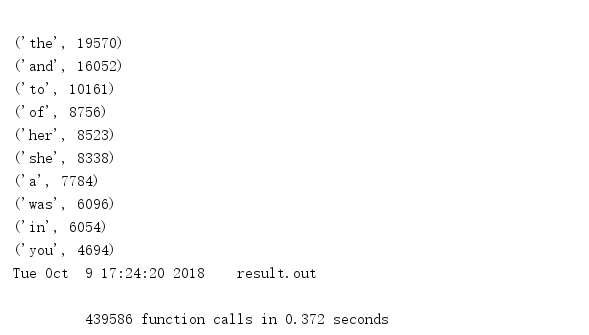
3、输出词频top10的单词
def output_result(word_freq):
    if word_freq:
        sorted_word_freq = sorted(word_freq.items(), key=lambda v: v[1], reverse=True)
        for item in sorted_word_freq[:10]:  # 输出 Top 10 的单词
            print(item)

4、结合前三个函数实现统计词频并输出前十的功能
if __name__ == "__main__":
    dst ="E:\作业\软件工程1\SE16_WordCount\Gone_with_the_wind.txt"
    bvffer = process_file(dst)
    word_freq = process_buffer(bvffer)
    output_result(word_freq)
三、代码风格
1、python2更新到python3是不兼容的,在python2中输出可写为print "hello world",在python3中必须加(),写为print("helloworld")
2、python与类C语言有比较大的区别,在语句后面不加分号
3、在python中用缩进来取代{ }的功能,tab键在python中一般会缩进4个空格而不是两个,但有的电脑系统因为配置方面不同可能使tab缩进的位数不同,所以尽量使用空格来缩进,例如
for s in '“”!?,.;:$':
bvffer=bvffer.replace(s,' ') #将找出的特殊符替换为空格
4、在if、else、for等条件判断语句后要加冒号,如上图
5、换行,每一条可执行语句为一行
6、为变量命名时要以字母或下划线开头
四、程序运行命令、运行结果截图
《飘》的词频统计运行截图
五、性能分析结果及改进
1、指出寻找执行时间、次数最多的部分代码
1.1 性能分析代码:
def test(): #将词频统计程序封装成测试程序
dst = "C:\\Users\pc\Desktop\文档\软件工程\Gone_with_the_wind.txt"
bvffer = process_file(dst)
word_freq = process_buffer(bvffer)
output_result(word_freq)
if __name__ == "__main__":
import cProfile
import pstats
cProfile.run("test()")
cProfile.run("test()", filename="result.out") # 把分析结果保存到文件中
p = pstats.Stats("result.out") # 创建Stats对象
p.strip_dirs().sort_stats("call").print_stats(10)# 按照函数名排序,只打印前3行函数的信息, 参数还可为小数,表示前百分之几的函数信息
p.strip_dirs().sort_stats("cumulative", "name").print_stats(0.5)# 按照运行时间和函数名进行排序
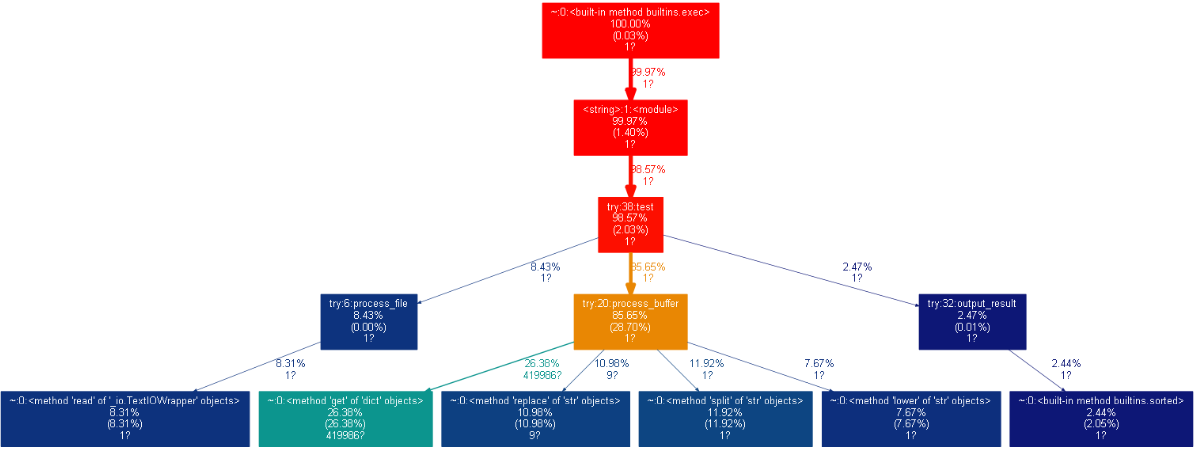
# 根据以上运行发现函数process_buffer()最耗时间
p.print_callees("process_buffer")# 查看process_buffer()函数中调用了哪些函数
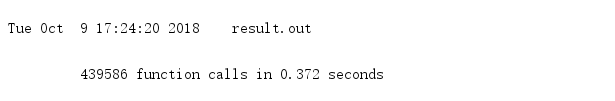
1.2 运行总耗时
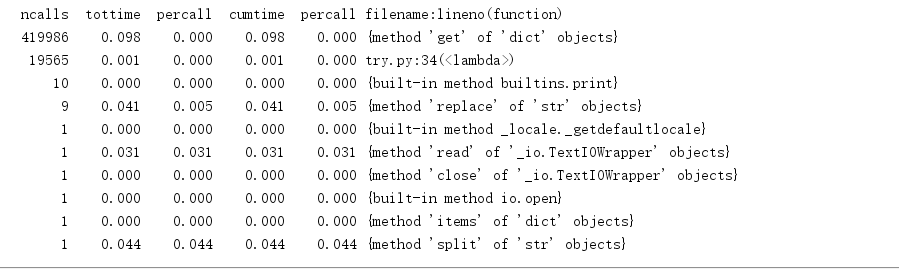
1.3 执行次数最多
执行次数最多的代码为:
word_freq[str] = word_freq.get(str, 0) + 1
1.4 运行时间最长
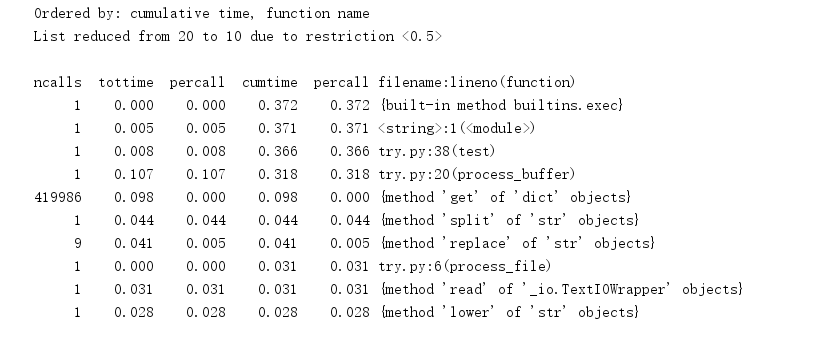
运行时间最长的代码仍然为
word_freq[str] = word_freq.get(str, 0) + 1
附:
ncalls:表示函数调用的次数;
tottime:表示指定函数的总的运行时间,除掉函数中调用子函数的运行时间;
percall:(第一个percall)等于 tottime/ncalls;
cumtime:表示该函数及其所有子函数的调用运行的时间,即函数开始调用到返回的时间;
percall:(第二个percall)即函数运行一次的平均时间,等于 cumtime/ncalls;
filename:lineno(function):每个函数调用的具体信息;
2、可视化操作

 浙公网安备 33010602011771号