


 代码
代码

/*****************************************************************************************************************
*版本:2D或者3D饼状统计图
*日期:2010.2.12
*作者:孙晓玮
*联系方式:454084563@qq.com
*说明:用VML实现饼状统计图
*bug:cake上升时的距离以及backdepth是不变的,设置的高宽太小或者太大,效果会不太好
*2D饼图与图例的互动问题
*****************************************************************************************************************/
var Stop1;
//函数作用:3dcake升起
//参数含义:cakeID,图例ID
function moveover3D(item,rec){
var item1=document.getElementById(item);
var rec1=document.getElementById(rec);
var position=parseInt(item1.style.top);
rec1.style.display = "";
if(position>-970){
item1.style.top=position-80;
Stop1=setTimeout("moveover3D(\""+item+"\",\""+rec+"\")",10)
}else{
return;
}
}
//函数作用:3dcake落下
//参数含义:cakeID,图例ID
function moveout3D(item,rec)
{
var item1=document.getElementById(item);
var rec1=document.getElementById(rec);
clearTimeout(Stop1);
item1.style.top=-250;
rec1.style.display = "none";
}
var Stop2;
var Num = 0;
//函数作用:2dcake弹出
//参数含义:cakeID,图例ID
function moveover2D(item,rec,midangle){
var item1=document.getElementById(item);
var rec1=document.getElementById(rec);
rec1.style.display = "";
if (Num<10) {
var length=50;
var xcur=Math.cos(midangle * Math.PI /180);
var ycur=Math.sin(midangle * Math.PI /180);
x=parseInt(xcur * length);
y=parseInt(ycur * length);
item1.style.top=1850 - Num*y;
item1.style.left=3825 + Num*x;
Stop2=setTimeout("moveover2D(\""+item+"\",\""+rec+"\",\""+midangle+"\")",10);
Num++;
}
}
//函数作用:2dcake弹回
//参数含义:cakeID,图例ID
function moveout2D(item,rec)
{
var item1=document.getElementById(item);
var rec1=document.getElementById(rec);
rec1.style.display = "none";
clearTimeout(Stop2);
Num = 0;
item1.style.top=1850;
item1.style.left=3825;
}
//////////////////////////////////////////////////////////////////////////////////
//函数作用:3D饼图类
//参数含义:父控件ID,宽,高,标题,数据数组,显示单位//建议宽高比5:3,也可随意设置
//pCakes二维数组有name,qty,color,颜色若设置null使用默认色表
//////////////////////////////////////////////////////////////////////////////////
function DrawPieChart(pContainer,pWidth,pHeight,pCakes,pCaption,pUnit,pType)//pCakes结构为(name ,value)
{
var container=document.getElementById(pContainer);
container.style.width=pWidth;
container.style.height=pHeight;
//添加背景
var background=document.createElement("<v:rect style='position:absolute;left:1px;top:1px;width:"+pWidth+"px;height:"+pHeight+"px;' fillcolor='#EFEFEF' strokecolor='gray'></v:rect>");
var shadow = document.createElement("<v:shadow on='t' type='single' color='silver' offset='4pt,4pt'/>");
background.appendChild(shadow);
container.appendChild(background);
var percent=new Array();
var total=0;
var defaultColor=new Array("#FF0000","#663366","#990099","#3300CC","33CCFF","#FF6600","#FFCC00","#CC33CC","#33CCCC","#33FF33","#CCFF66","009933","996600","#FF66FF","#003300","#Yellow","#Lime","Navy","#Blue");
for(var i=0;i<pCakes.length;i++){
total+=pCakes[i][1];
}
for(i=0;i<pCakes.length;i++)
{
percent[i]=pCakes[i][1]/total;
if (pCakes[i][2]==null)
{
pCakes[i][2] = defaultColor[(i%defaultColor.length)];
}
}
//创建画布///////////////////////////////////////////////////////////
var canvas=document.createElement("v:group");
canvas.style.position='absolute';
canvas.style.top='0px';
canvas.style.left='0px';
canvas.style.width=pWidth;
canvas.style.height=pHeight;
canvas.coordsize='21000,11500';
//大标题///////////////////////////////////////////////////////////
var caption=document.createElement("v:rect");
caption.style.position='relative';
caption.style.top='50px';
caption.style.left='550px';
caption.style.width='20000px';
caption.style.height='800px';
caption.fillcolor='#EFEFEF';
caption.stroked='false';
var captiontext=document.createElement("v:TextBox");
captiontext.inset='0pt,0pt,0pt,0pt';
var captiondiv = document.createElement("<div style='FONT-SIZE:20px;COLOR:#6633FF;WORD-BREAK;FONT-FAMILY:黑体;vertical-align:middle; text-align:center;'></div>");
captiondiv.innerHTML = pCaption;
captiontext.appendChild(captiondiv);
caption.appendChild(captiontext);
//作图区///////////////////////////////////////////////////////////
var drawSection=document.createElement("v:rect");
drawSection.style.position='relative';
drawSection.style.top=parseInt(caption.style.top)+parseInt(caption.style.height)+'px';
drawSection.style.left='550px';
drawSection.style.width='20000px';
drawSection.style.height='10000px';
drawSection.strokecolor='#888';
drawSection.fillcolor='#9fc';
drawSection.appendChild(document.createElement("<v:fill rotate='t' angle='-45' focus='100%' type='gradient'/>"));
//计算每个图例元素的高度///////////////////////////////////////////////////////////
var defaultHeight = 750;
var topx;
var dx = 20;//元素距离
if(pCakes.length*defaultHeight>8050)//如果超过图例高度,重新计算每个图例元素的高度
defaultHeight = parseInt((8050-(pCakes.length-1)*20)/pCakes.length);
//图例区域///////////////////////////////////////////////////////////
var legendArea=document.createElement("v:rect");
legendArea.style.position='relative';
legendArea.style.top='1350px';
legendArea.style.left='15000px';
legendArea.style.width='5000px';
legendArea.style.height=pCakes.length*defaultHeight+(pCakes.length-1)*dx+950;
legendArea.fillcolor='#9cf';
legendArea.stroked='t';
legendArea.strokecolor='#09f';
legendArea.appendChild(document.createElement("<v:fill rotate='t' angle='-175' focus='100%' type='gradient'/>"));
legendArea.appendChild(document.createElement("<v:shadow on='t' type='single' color='silver' offset='1pt,1pt'/>"));
//图例标题///////////////////////////////////////////////////////////
var legendTitle=document.createElement("v:rect");
legendTitle.style.position='relative';
legendTitle.style.top='1500px';
legendTitle.style.left='15200px';
legendTitle.style.width='4300px';
legendTitle.style.height='650px';
legendTitle.filled='f';
legendTitle.stroked='f';
legendTitle.strokecolor='#000';
var tb = document.createElement("<v:TextBox inset='2pt,0pt,0pt,0pt' style='FONT-SIZE:10pt;COLOR:#6633FF;'></v:TextBox>");
var tbdiv = document.createElement("<div style='align:left'></div>");
tbdiv.innerHTML = "Total:"+xRound(total,2)+"("+pUnit+")";
tb.appendChild(tbdiv);
legendTitle.appendChild(tb);
//添加到画布///////////////////////////////////////////////////////////
canvas.appendChild(caption);
canvas.appendChild(drawSection);
canvas.appendChild(legendArea);
canvas.appendChild(legendTitle);
//绘制图例///////////////////////////////////////////////////////////
for(var i=0;i<pCakes.length;i++)
{
topx=2150+i*(defaultHeight+dx);
//图例高亮区域///////////////////////////////////////////////////////////
var legendBg=document.createElement("v:rect");
legendBg.id=pContainer+'rec'+(i+1);
legendBg.style.position='relative';
legendBg.style.top=topx+'px';
legendBg.style.display='none';
legendBg.style.left='15200px';
legendBg.style.width='4300px';
legendBg.style.height=defaultHeight;
legendBg.fillcolor='#efefef';
legendBg.strokecolor=pCakes[i][2];
legendBg.appendChild(document.createElement("<v:fill opacity='.6' color2='fill darken(118)' o:opacity2='.6' rotate='t' method='linear sigma' focus='100%' type='gradient'/>"));
//图例元素///////////////////////////////////////////////////////////
var legendElement=document.createElement("v:rect");
legendElement.style.position='relative';
legendElement.style.top=topx+'px';
legendElement.style.left='15200px';
legendElement.style.width='1000px';
legendElement.style.height=defaultHeight;
legendElement.fillcolor=pCakes[i][2];
legendElement.stroked='f';
//图例汉字区域///////////////////////////////////////////////////////////
var legendTxt=document.createElement("v:rect");
legendTxt.style.position='relative';
legendTxt.style.top=topx+'px';
legendTxt.style.left='16300px';
legendTxt.style.width='3400px';
legendTxt.style.height=defaultHeight;
legendTxt.filled='f';
legendTxt.stroked='f';
var mouseAction;
if(pType=="3D")
mouseAction = "onmouseover='moveover3D(\""+pContainer+"cake"+(i+1)+"\",\""+pContainer+"rec"+(i+1)+"\")'onmouseout='moveout3D(\""+pContainer+"cake"+(i+1)+"\",\""+pContainer+"rec"+(i+1)+"\")'";
//else
// mouseAction = "onmouseover='moveover2D(\""+pContainer+"cake"+(i+1)+"\",\""+pContainer+"rec"+(i+1)+"\",\""+parseInt(360*(startAngle+endAngle/2))+"\")' onmouseout='moveout2D(\""+pContainer+"cake"+(i+1)+"\",\""+pContainer+"rec"+(i+1)+"\")'";
var tb1 = document.createElement("<v:TextBox inset='0pt,0pt,0pt,0pt' style='FONT-SIZE:9pt;COLOR:#6633FF;cursor:hand;'"+mouseAction+"></v:TextBox>");
var tbdiv1 = document.createElement("<div align='left'></div>");
tbdiv1.innerHTML = pCakes[i][0]+": "+xRound(pCakes[i][1],2);
tb1.appendChild(tbdiv1);
legendTxt.appendChild(tb1);
//添加到画布///////////////////////////////////////////////////////////
canvas.appendChild(legendBg);
canvas.appendChild(legendElement);
canvas.appendChild(legendTxt);
}
//画cake//////////////////////////////////////////////////////////
/*****************************************************************************************
设置Path,这个也就是比较令人难以看懂的部分了,我首先求出了startAngle和endAngle,startAngle的意义是这样的,
假设有3个数,0.2,0.2,0.4,对于第二项来说,startAngle应该是 0.25,endAngle是0.25,对于第三项来说,startAngle是0.5,
endAngle是0.5,总而言之,startAngle可以表示为前面数据所占的比例,engAngle表示当前数据所占的比例。Path有很多指令,
对于其他指令,我就不多作解释,而这里使用的是M 10800 10800 AE 10800 10800 10800 10800 start end 。对于shape我重新定义了
coordsize=21600,21600, m 10800 10800则表示移动到 10800 10800,就是移动到shape定义的中心,AE用来画曲线,总共有6个参数,
w3c的note描述如下center (x,y) size(w,h) start-angle, end-angle,前面四个参数不难理解,
剩下的两个参数我不是特别明白意思,但是在国外的一篇文章看到其中的算法如下应该是 2^16 * 度数,
对应于程序,就应该是startAngle * 2^16 * 360,因为我的startAngle是比例。
******************************************************************************************/
var startAngle=0.25; //默认起始点为3点位置, +0.25使起始点变为12点位置,就可以设置每隔cake的zIndex,才能以正常效果显示
var pieAngle=0;
var prePieAngle=0;
var mX=Math.pow(2,16)*360;
var zIndex = 10;
if (pType=="3D")//画3D饼图
{
for(i=0;i<pCakes.length;i++)
{
pieAngle = percent[i];
startAngle+=prePieAngle;
prePieAngle=pieAngle;
if (startAngle>=0.75) {//这里根据每个cake位置设置其zindex
zIndex-- ;
}
var cake=document.createElement("<v:shape coordsize='21600,21600' o:spt='95' title='"+pCakes[i][0]+": "+xRound(percent[i]*100,2)+"%' id='"+pContainer+"cake"+(i+1)+
"'style='position:relative;left:1875px;top:-250px;WIDTH:12000px;HEIGHT:12000px;z-index:"+zIndex+
"'fillcolor='"+pCakes[i][2]+
"'path='m 10800 10800 ae 10800 10800 10800 10800 "+parseInt(mX*startAngle)+" "+parseInt(mX*pieAngle)+" xe'"+
"' onmouseover='moveover3D(\""+pContainer+"cake"+(i+1)+"\",\""+pContainer+"rec"+(i+1)+"\")' onmouseout='moveout3D(\""+pContainer+"cake"+(i+1)+"\",\""+pContainer+"rec"+(i+1)+"\")'>"+
"</v:shape>");
cake.style.cursor='hand';
cake.innerHTML= "<v:fill opacity='60293f' color2='fill lighten(120)' o:opacity2='60293f' rotate='t' angle='-135' method='linear sigma' focus='100%' type='gradient'/>"+
"<o:extrusion v:ext='view' on='t' backdepth='16' rotationangle='60' viewpoint='0,0'viewpointorigin='0,0' skewamt='0' lightposition='-50000,-50000' lightposition2='50000'/>";
canvas.appendChild(cake);
}
}
else if(pType=="2D")//画2D饼图
{
for(i=0;i<pCakes.length;i++)
{
pieAngle = percent[i]; //所占百分比
startAngle+=prePieAngle; //当前cake的起始角度
prePieAngle=pieAngle;
if (startAngle>=0.75) {
zIndex-- ;
} //pCakes[i][0]xRound(percent[i]*100,2)
var cake=document.createElement("<v:shape coordsize='21600,21600' o:spt='95' title='"+pCakes[i][0]+": "+xRound(percent[i]*100,2)+"%' id='"+pContainer+"cake"+(i+1)+
"'style='position:relative;left:3825px;top:1850px;WIDTH:8000px;HEIGHT:8000px;z-index:"+zIndex+
"'fillcolor='"+pCakes[i][2]+
"'path='m 10800 10800 ae 10800 10800 10800 10800 "+parseInt(mX*startAngle)+" "+parseInt(mX*pieAngle)+" xe'"+
"' onmouseover='moveover2D(\""+pContainer+"cake"+(i+1)+"\",\""+pContainer+"rec"+(i+1)+"\",\""+parseInt(360*(startAngle+pieAngle/2))+"\")' onmouseout='moveout2D(\""+pContainer+"cake"+(i+1)+"\",\""+pContainer+"rec"+(i+1)+"\")'>"+
"</v:shape>");
cake.style.cursor='hand';
cake.innerHTML= "<v:fill opacity='60293f' color2='fill lighten(120)' o:opacity2='60293f' rotate='t' angle='-135' method='linear sigma' focus='100%' type='gradient'/>"+
"<o:extrusion v:ext='view' on='t' backdepth='0' rotationangle='0' viewpoint='0,0'viewpointorigin='0,0' skewamt='0' lightposition='-50000,-50000' lightposition2='50000'/>";
canvas.appendChild(cake);
}
}
container.appendChild(canvas);
}
//函数作用:数值格式化
//参数含义:待格式化数字,小数保留位数
function xRound(num,n)
{
num = Math.round (num*Math.pow(10,n))/Math.pow(10,n);
return num;
}
一些原理啊 也是根据网上高手研究透的,然后基于他们的修改的, 加入了自己的想法。 具体不多说,自己研究吧。2dcake鼠标联动效果没加上,懒得搞了。
下面是使用方法
代码
<%@ Page Language="C#" AutoEventWireup="true" CodeBehind="HistoryStatistic.aspx.cs" Inherits="VmlProject.HistoryStatistic" %>
<!DOCTYPE html PUBLIC "-//W3C//DTD XHTML 1.0 Transitional//EN" "http://www.w3.org/TR/xhtml1/DTD/xhtml1-transitional.dtd">
<html xmlns:v="urn:schemas-microsoft-com:vml" xmlns:o="urn:schemas-microsoft-com:office:office">
<head id="Head1" runat="server">
<style type="text/css">
v\:*
{
behavior: url(#default#VML);
}
o\:*
{
behavior: url(#default#VML);
}
body
{
font-family: arial;
}
</style>
<meta http-equiv="Content-Type" content="text/html; charset=gb2312" />
<title>无标题页</title>
<script src="js/jquery.js" type="text/javascript"></script>
<script src="js/PieChart.js" type="text/javascript"></script>
<script src="js/RectChart3D.js" type="text/javascript"></script>
<script src="js/RectChart.js" type="text/javascript"></script>
</head>
<body>
<form id="form1" runat="server">
<div>
<div id="div1" style="position:relative; float:left;"></div>
<div id="div2" style="position:relative; float:left;margin-left:10px;"></div>
<div id="div3" style="position:relative; margin-top:10px; float:left; width:500px; height:300px;"></div>
<div id="div4" style="position:relative; float:left;margin-top:10px; margin-left:10px;"></div>
</div>
<script language="javascript" type="text/javascript">
var pData = new Array();
for(i=0;i<10;i++)
{
var oData=new Object();
oData[0]=i*100;
oData[1]=Math.random()*10;
pData[i]=oData;
}
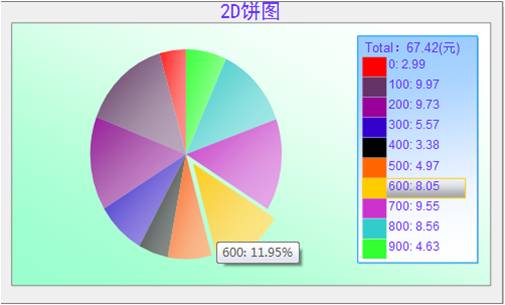
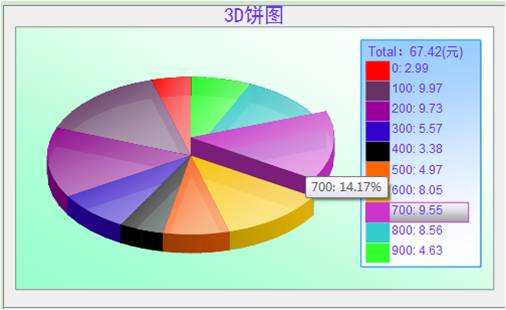
DrawPieChart("div1",500,300,pData,"3D饼图","元","3D");
DrawPieChart("div2",500,300,pData,"2D饼图","元","2D");
DrawRectChart("div4",pData,500,300,"2D柱图", "天", "元","2D")
//////////////////////////////////////////////////////////
pData = new Array();
var oData;
for(i=0;i<16;i++)
{
oData=new Object();
oData[0]=i;
oData[1]=i*3;
oData[2]=i*6;
oData[3]=i*2;
oData[4]=i*4;
pData[i]=oData;
}
var aaa = new RectChart3D('div3',500,300,null,false,null);
aaa.SetCaptionAtt('实时监测柱状图',null,null);
aaa.SetxAxisAtt('时间',null,null,null,null);
aaa.SetyAxisAtt(0,100,2,'值',null,null,null,6,null);
aaa.SetData(pData,pData,5,oData);
aaa.Draw();
aaa.AddRect();
</script>
</form>
</body>
</html>
<!DOCTYPE html PUBLIC "-//W3C//DTD XHTML 1.0 Transitional//EN" "http://www.w3.org/TR/xhtml1/DTD/xhtml1-transitional.dtd">
<html xmlns:v="urn:schemas-microsoft-com:vml" xmlns:o="urn:schemas-microsoft-com:office:office">
<head id="Head1" runat="server">
<style type="text/css">
v\:*
{
behavior: url(#default#VML);
}
o\:*
{
behavior: url(#default#VML);
}
body
{
font-family: arial;
}
</style>
<meta http-equiv="Content-Type" content="text/html; charset=gb2312" />
<title>无标题页</title>
<script src="js/jquery.js" type="text/javascript"></script>
<script src="js/PieChart.js" type="text/javascript"></script>
<script src="js/RectChart3D.js" type="text/javascript"></script>
<script src="js/RectChart.js" type="text/javascript"></script>
</head>
<body>
<form id="form1" runat="server">
<div>
<div id="div1" style="position:relative; float:left;"></div>
<div id="div2" style="position:relative; float:left;margin-left:10px;"></div>
<div id="div3" style="position:relative; margin-top:10px; float:left; width:500px; height:300px;"></div>
<div id="div4" style="position:relative; float:left;margin-top:10px; margin-left:10px;"></div>
</div>
<script language="javascript" type="text/javascript">
var pData = new Array();
for(i=0;i<10;i++)
{
var oData=new Object();
oData[0]=i*100;
oData[1]=Math.random()*10;
pData[i]=oData;
}
DrawPieChart("div1",500,300,pData,"3D饼图","元","3D");
DrawPieChart("div2",500,300,pData,"2D饼图","元","2D");
DrawRectChart("div4",pData,500,300,"2D柱图", "天", "元","2D")
//////////////////////////////////////////////////////////
pData = new Array();
var oData;
for(i=0;i<16;i++)
{
oData=new Object();
oData[0]=i;
oData[1]=i*3;
oData[2]=i*6;
oData[3]=i*2;
oData[4]=i*4;
pData[i]=oData;
}
var aaa = new RectChart3D('div3',500,300,null,false,null);
aaa.SetCaptionAtt('实时监测柱状图',null,null);
aaa.SetxAxisAtt('时间',null,null,null,null);
aaa.SetyAxisAtt(0,100,2,'值',null,null,null,6,null);
aaa.SetData(pData,pData,5,oData);
aaa.Draw();
aaa.AddRect();
</script>
</form>
</body>
</html>

 浙公网安备 33010602011771号