python matplotlib实现数据可视化
先安装matplotlib
sudo pip install matplotlib
代码:
import matplotlib
matplotlib.use('Agg')#linux系统下用使用该设置
import matplotlib.pyplot as plt
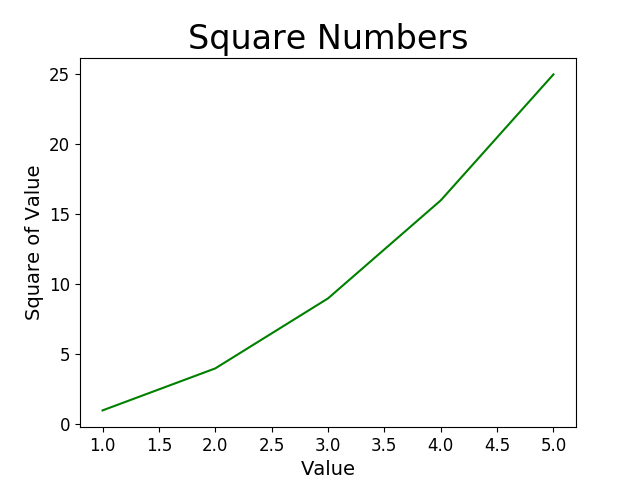
input_values = [1, 2, 3, 4, 5]
squares = [1, 4, 9, 16, 25]
plt.plot(input_values,squares,color='#008000')
plt.title("Square Numbers", fontsize=24)
plt.xlabel("Value", fontsize=14)
plt.ylabel("Square of Value", fontsize=14)
plt.tick_params(axis='both', labelsize=12)
plt.savefig("Histogram.png")
plt.show()
运行结果:
生成Histogram.png


 浙公网安备 33010602011771号