第五次编程作业-Regularized Linear Regression and Bias v.s. Variance
1.正规化的线性回归
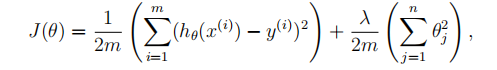
(1)代价函数
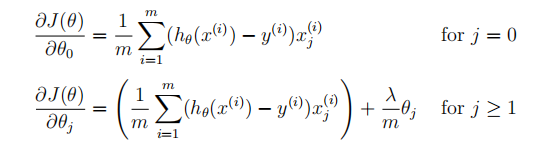
(2)梯度
linearRegCostFunction.m
function [J, grad] = linearRegCostFunction(X, y, theta, lambda)
%LINEARREGCOSTFUNCTION Compute cost and gradient for regularized linear
%regression with multiple variables
%   [J, grad] = LINEARREGCOSTFUNCTION(X, y, theta, lambda) computes the
%   cost of using theta as the parameter for linear regression to fit the
%   data points in X and y. Returns the cost in J and the gradient in grad

% Initialize some useful values
m = length(y); % number of training examples

% You need to return the following variables correctly
J = 0;
grad = zeros(size(theta));

% ====================== YOUR CODE HERE ======================
% Instructions: Compute the cost and gradient of regularized linear
%               regression for a particular choice of theta.
%
%               You should set J to the cost and grad to the gradient.
%
%求h(θ)
h = X * theta;
J = 1/2/m *((h-y)'*(h-y)) + lambda/2/m*(theta(2:end,:)'*theta(2:end,:));
grad(1,1) = X(:,1)'*(h-y)/m;
grad(2:end,1) = X(:,2:end)'*(h-y)/m +lambda/m * theta(2:end,1);
% =========================================================================
grad = grad(:);

end
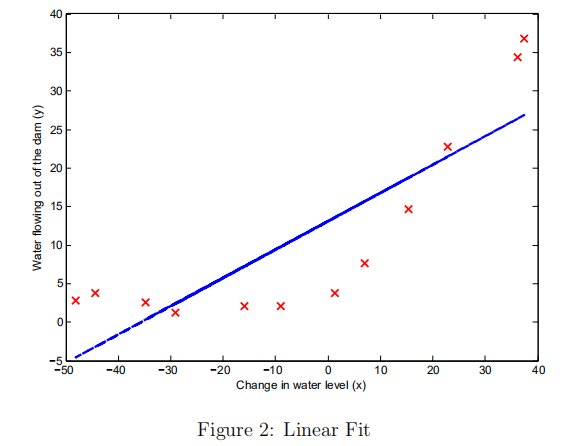
用fmincg最优的theta来拟合线性回归,画出线性回归函数(在这里是低维度的可以画出来)
2.偏差与方差
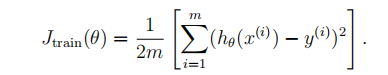
(1)求训练样本的误差代价:
(2)交叉样本集
Jcv
learningCurve.m
function [error_train, error_val] = ...
    learningCurve(X, y, Xval, yval, lambda)
%LEARNINGCURVE Generates the train and cross validation set errors needed
%to plot a learning curve
%   [error_train, error_val] = ...
%       LEARNINGCURVE(X, y, Xval, yval, lambda) returns the train and
%       cross validation set errors for a learning curve. In particular,
%       it returns two vectors of the same length - error_train and
%       error_val. Then, error_train(i) contains the training error for
%       i examples (and similarly for error_val(i)).
%
%   In this function, you will compute the train and test errors for
%   dataset sizes from 1 up to m. In practice, when working with larger
%   datasets, you might want to do this in larger intervals.
%

% Number of training examples
m = size(X, 1);

% You need to return these values correctly
error_train = zeros(m, 1);
error_val   = zeros(m, 1);

% ====================== YOUR CODE HERE ======================
% Instructions: Fill in this function to return training errors in
%               error_train and the cross validation errors in error_val.
%               i.e., error_train(i) and
%               error_val(i) should give you the errors
%               obtained after training on i examples.
%
% Note: You should evaluate the training error on the first i training
%       examples (i.e., X(1:i, :) and y(1:i)).
%
%       For the cross-validation error, you should instead evaluate on
%       the _entire_ cross validation set (Xval and yval).
%
% Note: If you are using your cost function (linearRegCostFunction)
%       to compute the training and cross validation error, you should
%       call the function with the lambda argument set to 0.
%       Do note that you will still need to use lambda when running
%       the training to obtain the theta parameters.
%
% Hint: You can loop over the examples with the following:
%
%       for i = 1:m
%           % Compute train/cross validation errors using training examples
%           % X(1:i, :) and y(1:i), storing the result in
%           % error_train(i) and error_val(i)
%           ....
%
%       end
%

% ---------------------- Sample Solution ----------------------

%进行训练的时候,对训练样本i个进行训练得到theta值,再求J

 for i = 1:m
    theta = trainLinearReg(X(1:i,:), y(1:i), lambda);
    error_train(i) = linearRegCostFunction(X(1:i,:), y(1:i), theta, 0);
    error_val(i) = linearRegCostFunction(Xval, yval,theta,0);
 end

% -------------------------------------------------------------

% =========================================================================

end
学习曲线如下:

3.多项式回归
(1) 上面学习曲线可以看出来高偏差,欠拟合。采用增加特性来拟合,即多项式如下:

polyFeatures.m
function [X_poly] = polyFeatures(X, p)
%POLYFEATURES Maps X (1D vector) into the p-th power
%   [X_poly] = POLYFEATURES(X, p) takes a data matrix X (size m x 1) and
%   maps each example into its polynomial features where
%   X_poly(i, :) = [X(i) X(i).^2 X(i).^3 ...  X(i).^p];
%


% You need to return the following variables correctly.
X_poly = zeros(numel(X), p);

% ====================== YOUR CODE HERE ======================
% Instructions: Given a vector X, return a matrix X_poly where the p-th
%               column of X contains the values of X to the p-th power.
%
%
for i=1:p
    X_poly(:,i) = X.^i;
end
% =========================================================================

end
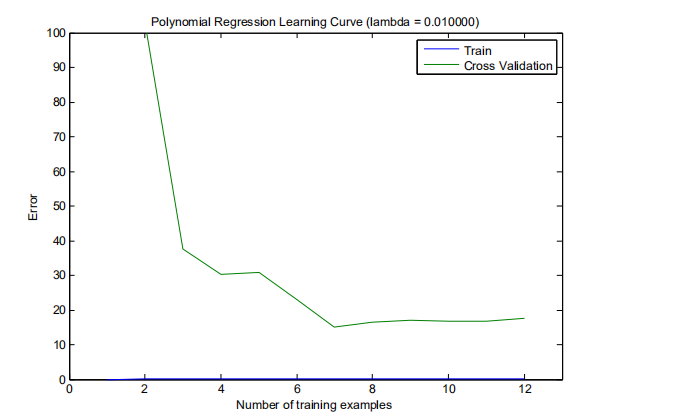
(2) 画出学习曲线
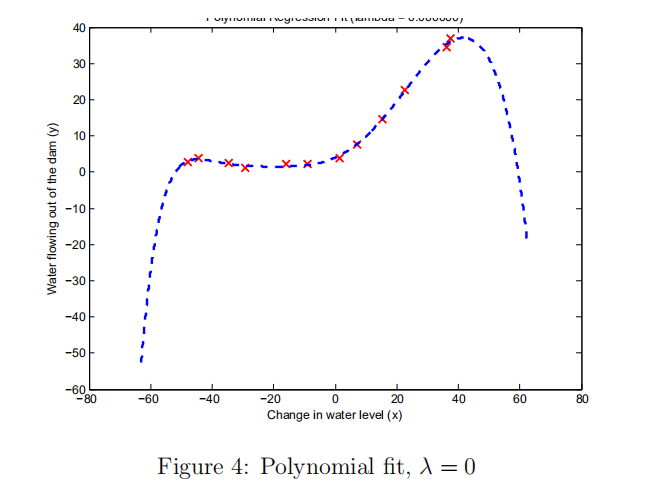
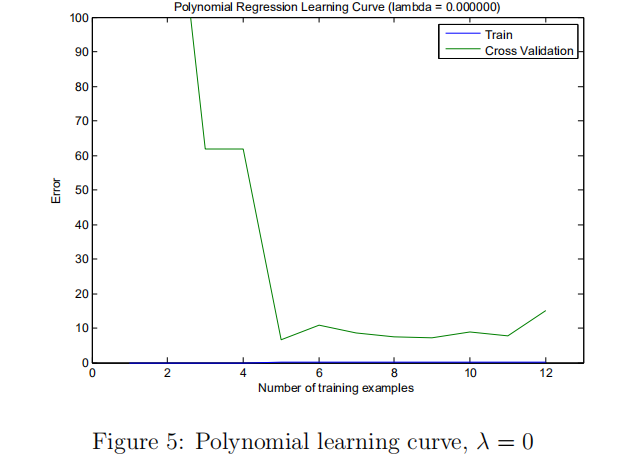
(2)可以看出出现了高方差,过拟合。选择一个好的正则化参数lambda。
利用交叉验证集来选择合适的lambda,选择最小的Jcv对应的lambda。(在这里求代价误差的时候就不用加正则化项了)
trainLinearReg.m
function [lambda_vec, error_train, error_val] = ...
    validationCurve(X, y, Xval, yval)
%VALIDATIONCURVE Generate the train and validation errors needed to
%plot a validation curve that we can use to select lambda
%   [lambda_vec, error_train, error_val] = ...
%       VALIDATIONCURVE(X, y, Xval, yval) returns the train
%       and validation errors (in error_train, error_val)
%       for different values of lambda. You are given the training set (X,
%       y) and validation set (Xval, yval).
%

% Selected values of lambda (you should not change this)
lambda_vec = [0 0.001 0.003 0.01 0.03 0.1 0.3 1 3 10]';

% You need to return these variables correctly.
error_train = zeros(length(lambda_vec), 1);
error_val = zeros(length(lambda_vec), 1);

% ====================== YOUR CODE HERE ======================
% Instructions: Fill in this function to return training errors in
%               error_train and the validation errors in error_val. The
%               vector lambda_vec contains the different lambda parameters
%               to use for each calculation of the errors, i.e,
%               error_train(i), and error_val(i) should give
%               you the errors obtained after training with
%               lambda = lambda_vec(i)
%
% Note: You can loop over lambda_vec with the following:
%
%       for i = 1:length(lambda_vec)
%           lambda = lambda_vec(i);
%           % Compute train / val errors when training linear
%           % regression with regularization parameter lambda
%           % You should store the result in error_train(i)
%           % and error_val(i)
%           ....
%
%       end
%
for i = 1:length(lambda_vec)
    lambda = lambda_vec(i);
    theta = trainLinearReg(X, y, lambda); %10x1选择最优的theta
    error_train(i,1) = linearRegCostFunction(X, y, theta, 0);
    error_val(i,1)  = linearRegCostFunction(Xval, yval, theta, 0);
end

% =========================================================================

end
(3)计算测试集代价误差3.8599,(根据上面得到的最优的λ= 3)
(4)画出学习曲线

 浙公网安备 33010602011771号