
cpu和核心关系,负载 lscpu uptime mpstat pidstat iostat iotop
cpu和核心关系
[root@cat logs]# lscpu
Architecture:          x86_64
CPU op-mode(s):        32-bit, 64-bit
Byte Order:            Little Endian
CPU(s):                8//8个核心
On-line CPU(s) list:   0-7
Thread(s) per core:    2
Core(s) per socket:    4//每颗cpu有几个核心
Socket(s):             1//1颗cpu
NUMA node(s):          1
Vendor ID:             GenuineIntel
CPU family:            6
Model:                 94
Model name:            Intel(R) Core(TM) i7-6700 CPU @ 3.40GHz
Stepping:              3
CPU MHz:               800.000
BogoMIPS:              6816.07
Virtualization:        VT-x
L1d cache:             32K
L1i cache:             32K
L2 cache:              256K
L3 cache:              8192K
NUMA node0 CPU(s):     0-7
平均负载
1分钟、5分钟、15分钟
$ uptime
 07:40:47 up 24 min,  2 users,  load average: 0.14, 0.14, 0.19
- 单位时间 内,系统处于 可运行状态 和 不可中断状态 的平均进程数,也就是 平均活跃进程数 ,它和CPU使用率并没有直接关系
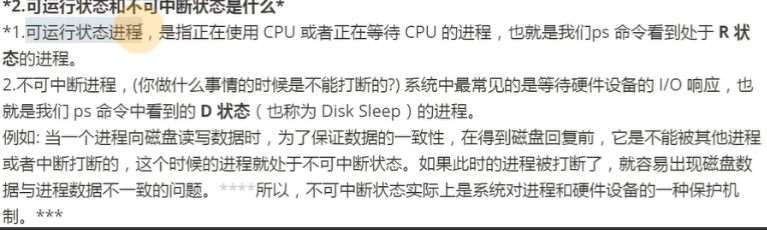
- 所谓 可运行状态 的进程,是指 正在使用CPU 或者 正在等待CPU 的进程
- 也就是我们常用ps命令看到的,处于 R 状态( Running 或 Runnable )的进程
- 不可中断状态 的进程则是正处于 内核态关键流程 中的进程,并且这些流程是 不可打断 的
- 比如最常见的是 等待硬件设备的I/O响应也就是我们在ps命令中看到的 D 状态( Uninterruptible Sleep ,也称为 Disk Sleep )的进程
- 当一个进程向磁盘读写数据时,为了 保证数据的一致性
- 在得到磁盘回复前,它是不能被其他进程或者中断打断的,这个时候的进程就处于不可中断状态
- 不可中断状态实际上是系统对 进程 和 硬件设备 的一种 保护机制
- 比如最常见的是 等待硬件设备的I/O响应也就是我们在ps命令中看到的 D 状态( Uninterruptible Sleep ,也称为 Disk Sleep )的进程

理想情况
平均负载 = CPU个数
$ grep 'model name' /proc/cpuinfo | wc -l
32

$ top 1
top - 08:04:15 up 48 min,  2 users,  load average: 0.07, 0.09, 0.09
Tasks: 201 total,   1 running, 200 sleeping,   0 stopped,   0 zombie
%Cpu0  :  0.0 us,  0.0 sy,  0.0 ni,100.0 id,  0.0 wa,  0.0 hi,  0.0 si,  0.0 st
%Cpu1  :  0.0 us,  0.0 sy,  0.0 ni, 99.7 id,  0.0 wa,  0.0 hi,  0.3 si,  0.0 st
经验值
关注时机: 平均负载 >= CPU * 70%
平均负载 / CPU 使用率
- 平均负载 – 平均活跃进程数CPU 使用率 – 单位时间内 CPU繁忙情况 的统计
- 单位时间内,处于 可运行状态 和 不可中断状态 的进程数
- 两者不一定完全对应
- CPU密集型 进程,使用大量CPU会导致平均负载升高,此时这两者是 一致 的
- I/O密集型 进程, 等待I/O 也会导致平均负载升高,但 CPU使用率不一定很高
- (并发)大量等待CPU的进程调度 也会导致平均负载升高,此时的CPU使用率也会比较高
[root@cat logs]# w
 09:40:30 up 441 days, 23:36,  5 users,  load average: 0.92, 1.12, 1.22
USER     TTY      FROM              LOGIN@   IDLE   JCPU   PCPU WHAT
root     tty1     -                01Jun21 441days  0.17s  0.17s -bash
liexin52 pts/0    192.168.1.168    08Aug22  0.00s  0.19s  0.03s sshd: liexin521 [priv]
liexin52 pts/1    lcrm_new.liexin. 08Aug22 46:41m  0.09s  0.02s sshd: liexin521 [priv]
root     pts/3    192.168.1.18     26Jul22 43:25m  0.08s  0.08s -bash
root     pts/8    192.168.1.192    Mon12   45:34m  0.07s  0.07s -bash
工具
| 工具 | 用途 |
|---|---|
| stress | Linux系统压力测试工具 |
| sysstat | 常用的 Linux 性能工具,监控和分析系统的性能 |
| mpstat :多核CPU性能分析工具,用来实时查看每个CPU的性能指标,以及所有CPU的平均指标 | |
| pidstat :进程性能分析工具,用来实时查看进程的CPU、内存、I/O以及上下文切换等性能指标 |
案例
CPU密集型
平均负载高,CPU 使用率也高
发起压力
root@ubuntu:~# stress --cpu 1 --timeout 600
stress: info: [4783] dispatching hogs: 1 cpu, 0 io, 0 vm, 0 hdd
平均负载
root@ubuntu:~# watch -d uptime
 08:35:03 up  1:19,  5 users,  load average: 1.08, 0.89, 0.50
CPU 使用率
CPU 1的使用率为99.8%,但 iowait为0,平均负载的升高正是由于 CPU 的使用率为100%
root@ubuntu:~# mpstat -P ALL 5
Linux 5.4.0-62-generic (ubuntu)     02/02/21     _x86_64_    (2 CPU)

08:40:12     CPU    %usr   %nice    %sys   %iowait    %irq   %soft  %steal  %guest  %gnice   %idle
08:40:17     all   50.05    0.00    0.20    0.00    0.00    0.10    0.00    0.00    0.00   49.65
08:40:17       0    0.00    0.00    0.20    0.00    0.00    0.20    0.00    0.00    0.00   99.60
08:40:17       1   99.80    0.00    0.20    0.00    0.00    0.00    0.00    0.00    0.00    0.00
进程的 CPU 使用率
root@ubuntu:~# pidstat -u 5 1
Linux 5.4.0-62-generic (ubuntu)     02/02/21     _x86_64_    (2 CPU)

08:40:26      UID       PID    %usr %system  %guest   %wait    %CPU   CPU  Command
08:40:31        0       694    0.00    0.20    0.00    0.00    0.20     1  multipathd
08:40:31        0       743    0.20    0.00    0.00    0.00    0.20     0  vmtoolsd
08:40:31        0      3814    0.00    0.40    0.00    0.00    0.40     0  kworker/0:1-events
08:40:31        0      6187   99.80    0.00    0.00    0.20   99.80     1  stress

Average:      UID       PID    %usr %system  %guest   %wait    %CPU   CPU  Command
Average:        0       694    0.00    0.20    0.00    0.00    0.20     -  multipathd
Average:        0       743    0.20    0.00    0.00    0.00    0.20     -  vmtoolsd
Average:        0      3814    0.00    0.40    0.00    0.00    0.40     -  kworker/0:1-events
Average:        0      6187   99.80    0.00    0.00    0.20   99.80     -  stress

IO 密集型 –%iowait
平均负载高,但 CPU 使用率不高
发起压力
模拟IO 压力,不断执行sync
root@ubuntu:~# stress --io 1 --timeout 600
stress: info: [8941] dispatching hogs: 0 cpu, 1 io, 0 vm, 0 hdd
平均负载
root@ubuntu:~# watch -d uptime
 08:59:04 up  1:43,  5 users,  load average: 1.06, 0.58, 0.37
CPU 使用率
CPU 使用率不高,但 %iowait 很高
root@ubuntu:~# mpstat -P ALL 5
Linux 5.4.0-62-generic (ubuntu)     02/02/21     _x86_64_    (2 CPU)

08:55:52     CPU    %usr   %nice    %sys  %iowait    %irq   %soft  %steal  %guest  %gnice   %idle
08:55:57     all    0.21    0.00   12.07   32.67    0.00    0.21    0.00    0.00    0.00   54.84
08:55:57       0    0.43    0.00   23.87   67.53    0.00    0.43    0.00    0.00    0.00    7.74
08:55:57       1    0.00    0.00    0.81    0.20    0.00    0.00    0.00    0.00    0.00   98.99
压力测试:8个进程 一个进程写1g

iostat
[root@host-234 ~]# iostat
Linux 3.10.0-1127.19.1.el7.x86_64 (host-234)     2022年08月17日     _x86_64_    (32 CPU)

avg-cpu:  %user   %nice %system %iowait  %steal   %idle
           1.61    0.00    0.74    0.30    0.00   97.34

Device:            tps    kB_read/s    kB_wrtn/s    kB_read    kB_wrtn
sdb              14.40         1.41       308.56   53843909 11814063450
sda              17.47        13.29       373.83  508979129 14313025448
dm-0              3.98         9.91        27.04  379521960 1035293816
dm-1              0.27         0.29         0.79   10929152   30295048
dm-2              5.63         3.10       345.98  118521576 13246791308
dm-3             18.15         1.41       308.58   53814784 11814705692
dm-4             61.06      1276.28       231.08 48866147007 8847722188
dm-5              0.08         0.01         2.61     437776   99887371
dm-6              0.10         0.02         2.54     626500   97072884
dm-17             0.06         0.02         1.93     676396   74035226
dm-18             0.00         0.00         0.00     129956      10067
dm-19             0.00         0.00         0.00     146961      11486
dm-10             0.06         0.09         1.55    3353342   59327101
dm-8              0.00         0.00         0.00     158923      63592
dm-9              0.07         0.36         1.41   13791169   54042151
dm-13             0.00         0.02         0.00     608332      95174
dm-11             0.00         0.01         0.00     200058      76432
dm-12             2.54         9.93        81.39  380211145 3116143442
dm-14             0.00         0.02         0.00     908663     107019
dm-15             0.00         0.01         0.00     229295      88952
dm-16             0.00         0.00         0.01     100564     352063
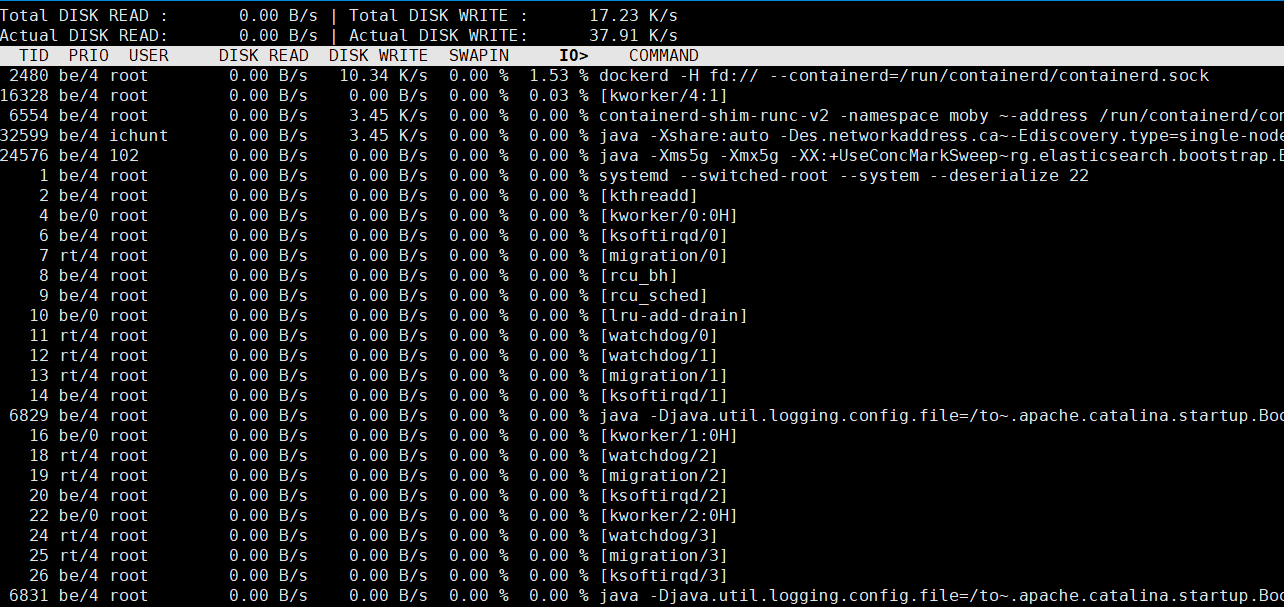
iotop
root@ubuntu:~# pidstat -u 5 1
Linux 5.4.0-62-generic (ubuntu)     02/02/21     _x86_64_    (2 CPU)

08:40:31      UID       PID    %usr %system  %guest   %wait    %CPU   CPU  Command
08:40:31        0       104    0.00    3.39    0.00    0.00    3.39     1  kworker/1:1H
08:40:31        0       109    0.00    0.40    0.00    0.00    0.40     0  kworker/0:1H
08:40:31        0      2997    2.00   35.53    0.00    3.99   37.52     1  stress
08:40:31        0      3057    0.00    0.40    0.00    0.00    0.40     0  pidstat
--大量进程 –%wait----
平均负载高,CPU 使用率也高
发起压力
运行进程超出 CPU 的运行能力,出现等待 CPU 的进程
root@ubuntu:~# stress --cpu 8 --timeout 600   或  stree -c 4 --timeout 600
stress: info: [7773] dispatching hogs: 8 cpu, 0 io, 0 vm, 0 hdd
平均负载
root@ubuntu:~# watch -d uptime
 08:59:04 up  1:43,  5 users,  load average: 8.10, 6.11, 3.29
CPU 使用率
CPU 的使用率都已经是100%
%iowait : Show the percentage of time that the CPU or CPUs were idle during which the system had an outstanding disk I/O request.


root@ubuntu:~# mpstat -P ALL 5
Linux 5.4.0-62-generic (ubuntu)     02/02/21     _x86_64_    (2 CPU)

08:55:52     CPU    %usr   %nice    %sys %iowait    %irq   %soft  %steal  %guest  %gnice   %idle
08:55:57     all  100.00    0.00    0.00    0.00    0.00    0.00    0.00    0.00    0.00    0.00
08:55:57       0  100.00    0.00    0.00    0.00    0.00    0.00    0.00    0.00    0.00    0.00
08:55:57       1  100.00    0.00    0.00    0.00    0.00    0.00    0.00    0.00    0.00    0.00
进程的 CPU 使用率
8个进程争抢2个 CPU, %wait 很高
%wait : Percentage of CPU spent by the task while waiting to run.
root@ubuntu:~# pidstat -u 5 1
Linux 5.4.0-62-generic (ubuntu)     02/02/21     _x86_64_    (2 CPU)

08:56:26      UID       PID    %usr %system  %guest   %wait    %CPU   CPU  Command
08:56:31        0      7644    0.00    0.20    0.00    0.00    0.20     0  kworker/0:2-pm
08:56:31        0      7774   24.75    0.00    0.00   75.05   24.75     0  stress
08:56:31        0      7775   24.95    0.00    0.00   74.85   24.95     1  stress
08:56:31        0      7776   24.95    0.00    0.00   75.25   24.95     1  stress
08:56:31        0      7777   24.75    0.00    0.00   75.05   24.75     0  stress
08:56:31        0      7778   24.75    0.00    0.00   75.25   24.75     0  stress
08:56:31        0      7779   24.95    0.00    0.00   75.25   24.95     1  stress
08:56:31        0      7780   24.95    0.00    0.00   75.05   24.95     1  stress
08:56:31        0      7781   24.75    0.00    0.00   75.05   24.75     0  stress
08:56:31        0      8214    0.00    0.20    0.00    0.00    0.20     1  pidstat

Average:      UID       PID    %usr %system  %guest   %wait    %CPU   CPU  Command
Average:        0      7644    0.00    0.20    0.00    0.00    0.20     -  kworker/0:2-pm
Average:        0      7774   24.75    0.00    0.00   75.05   24.75     -  stress
Average:        0      7775   24.95    0.00    0.00   74.85   24.95     -  stress
Average:        0      7776   24.95    0.00    0.00   75.25   24.95     -  stress
Average:        0      7777   24.75    0.00    0.00   75.05   24.75     -  stress
Average:        0      7778   24.75    0.00    0.00   75.25   24.75     -  stress
Average:        0      7779   24.95    0.00    0.00   75.25   24.95     -  stress
Average:        0      7780   24.95    0.00    0.00   75.05   24.95     -  stress
Average:        0      7781   24.75    0.00    0.00   75.05   24.75     -  stress
Average:        0      8214    0.00    0.20    0.00    0.00    0.20     -  pidstat
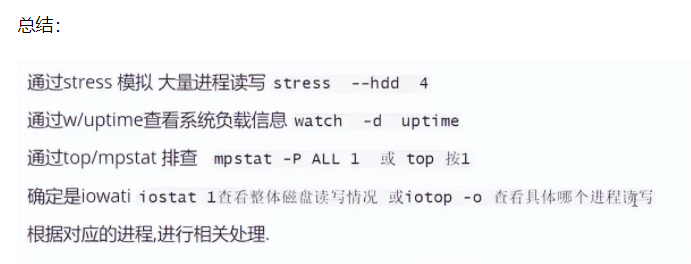
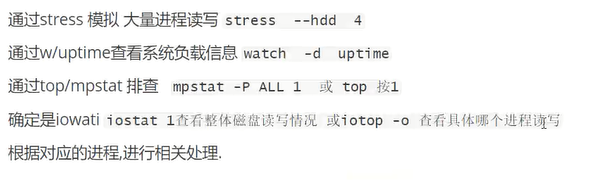
总结:
本文来自博客园,作者:孙龙-程序员,转载请注明原文链接:https://www.cnblogs.com/sunlong88/p/16593940.html

 浙公网安备 33010602011771号