

Angular G2 自定义图表-使用G2官方的方式
升级了angualr项目中的ng-zorro、ng-alain依赖包后发现使用g2-custom方式自定义的图表一直无法自适应宽度,只能手动设置宽的,针对这种情况解决方案有以下两种
方式一:
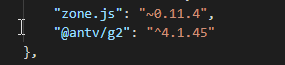
需要单独安装G2官方的包
package.js
具体的设置如下
使用DOM元素(以柱状图为例)
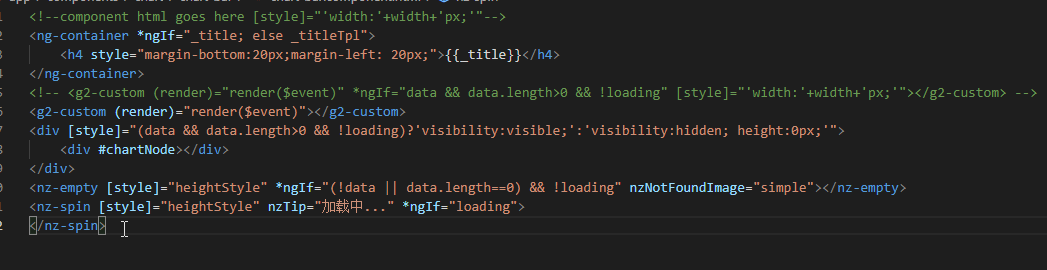
html
<ng-container *ngIf="_title; else _titleTpl">
    <h4 style="margin-bottom:20px;margin-left: 20px;">{{_title}}</h4>
</ng-container>
<!-- <g2-custom (render)="render($event)" *ngIf="data && data.length>0 && !loading"></g2-custom> -->
<div [style]="(data && data.length>0 && !loading)?'visibility:visible;':'visibility:hidden; height:0px;'">
    <div #chartNode></div>
</div>
<nz-empty [style]="heightStyle" *ngIf="(!data || data.length==0) && !loading" nzNotFoundImage="simple"></nz-empty>
<nz-spin [style]="heightStyle" nzTip="加载中..." *ngIf="loading">
</nz-spin>
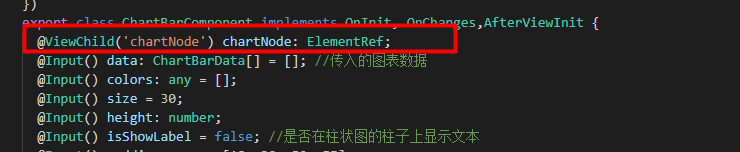
.ts

定义图表
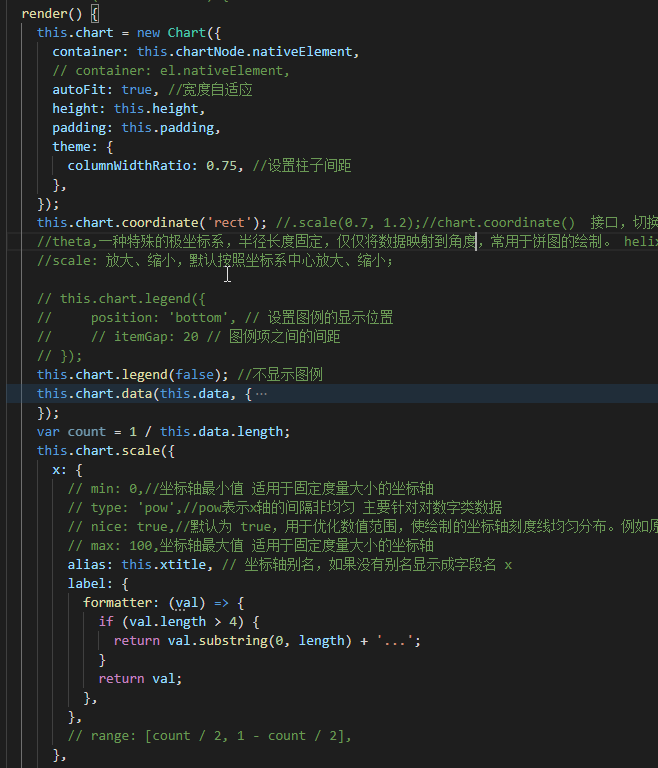
具体的设置参考另一篇博文 https://www.cnblogs.com/sugarwxx/p/13158163.html
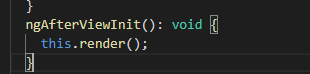
调用
由于DOM元素在生命周期钩子ngAfterViewInit之后才会实例化所以要在ngAfterViewInit中调用图表生成函数
方式二:
针对未单独安装官方G2使用g2-custom图表无法自适应的问题解决方法
1.html
.ts
根据g2-custom的render方法的调用作为生成图表的时机
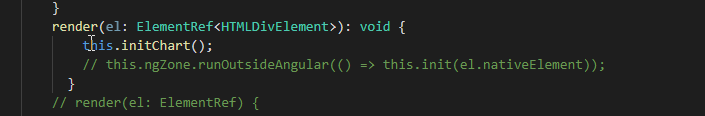
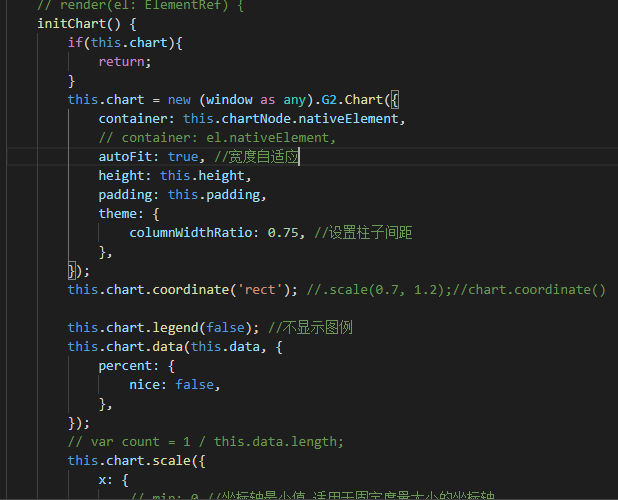
图表生成
ps:尝试不使用g2-custom的render而使用生命钩子ngAfterViewInit()来调用图表生成方法,代码执行到
new (window as any).G2.Chart({})处,会提示Chart不存在的异常
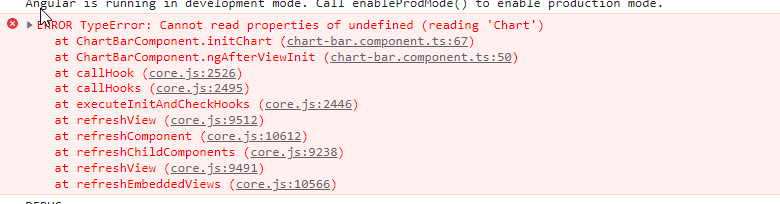
猜想是因为在ngAfterViewInit中调用时G2的一些内容未实例化导致的,具体的原因不明,欢迎各位解惑,提供更好的解决方法

 浙公网安备 33010602011771号